Unlock a world of possibilities! Login now and discover the exclusive benefits awaiting you.
- Qlik Community
- :
- All Forums
- :
- QlikView App Dev
- :
- Re: How do I pivot a 2-dimensions sales file?
- Subscribe to RSS Feed
- Mark Topic as New
- Mark Topic as Read
- Float this Topic for Current User
- Bookmark
- Subscribe
- Mute
- Printer Friendly Page
- Mark as New
- Bookmark
- Subscribe
- Mute
- Subscribe to RSS Feed
- Permalink
- Report Inappropriate Content
How do I pivot a 2-dimensions sales file?
Dear all, I would be grateful if someone could help me with the following issue.
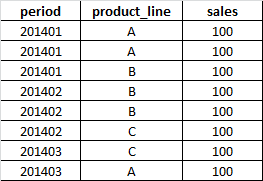
I have the following sales file
It is very easy to pivot it in excel, in order to obtain the following report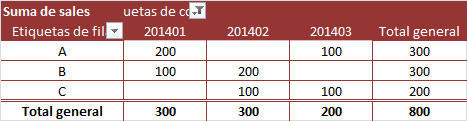
but I couldn't do in qlikview
I tried one expression for each month with set analysis i.e.
=sum({<Period={'201401'}>}sales) / =sum({<Period={'201402'}>}sales) / =sum({<Period={'201403'}>}sales)
with dimension ''product_line"... but the output is not what I expected..
I'm sure that this must be simple.
Thank you in advance for your help.
Regards
Leonardo
- Tags:
- new_to_qlikview
Accepted Solutions
- Mark as New
- Bookmark
- Subscribe
- Mute
- Subscribe to RSS Feed
- Permalink
- Report Inappropriate Content
Hi,
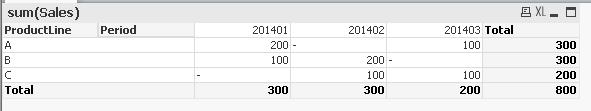
Create chart-> Pivot Table->
take dimension
Product_line,
Period
then go to
Expression tab ->Sum(Sales)
Go to Presentation ->select ->Always Fully Expandable
then drag Period Dimension to horizontal from Vertical.
For showing Total
Again Go to Presentation tab-> Select Dimension ->check Show Partial Sum.
Regards
Please appreciate our Qlik community members by giving Kudos for sharing their time for your query. If your query is answered, please mark the topic as resolved 🙂
- Mark as New
- Bookmark
- Subscribe
- Mute
- Subscribe to RSS Feed
- Permalink
- Report Inappropriate Content
Use Pivot table object of Qlik
- Mark as New
- Bookmark
- Subscribe
- Mute
- Subscribe to RSS Feed
- Permalink
- Report Inappropriate Content
Hi,
Create chart-> Pivot Table->
take dimension
Product_line,
Period
then go to
Expression tab ->Sum(Sales)
Go to Presentation ->select ->Always Fully Expandable
then drag Period Dimension to horizontal from Vertical.
For showing Total
Again Go to Presentation tab-> Select Dimension ->check Show Partial Sum.
Regards
Please appreciate our Qlik community members by giving Kudos for sharing their time for your query. If your query is answered, please mark the topic as resolved 🙂
- Mark as New
- Bookmark
- Subscribe
- Mute
- Subscribe to RSS Feed
- Permalink
- Report Inappropriate Content
- Mark as New
- Bookmark
- Subscribe
- Mute
- Subscribe to RSS Feed
- Permalink
- Report Inappropriate Content
Fallow max instruction and if you find out that the Partial Sum Option is greyed out go to Style tab and unticked the "Intedn mode".
- Mark as New
- Bookmark
- Subscribe
- Mute
- Subscribe to RSS Feed
- Permalink
- Report Inappropriate Content
Hi,
PFA
- Mark as New
- Bookmark
- Subscribe
- Mute
- Subscribe to RSS Feed
- Permalink
- Report Inappropriate Content
HI,
PFA
- Mark as New
- Bookmark
- Subscribe
- Mute
- Subscribe to RSS Feed
- Permalink
- Report Inappropriate Content
i think it wil be possible by using cross table