Unlock a world of possibilities! Login now and discover the exclusive benefits awaiting you.
- Qlik Community
- :
- All Forums
- :
- QlikView App Dev
- :
- How do i produce a pivot table which lists top 5 a...
- Subscribe to RSS Feed
- Mark Topic as New
- Mark Topic as Read
- Float this Topic for Current User
- Bookmark
- Subscribe
- Mute
- Printer Friendly Page
- Mark as New
- Bookmark
- Subscribe
- Mute
- Subscribe to RSS Feed
- Permalink
- Report Inappropriate Content
How do i produce a pivot table which lists top 5 answered questions per month?
I'm looking to create a pivot table which is based on a ranking per month of the top five answered questions (based on NO answers) in an office survey, similar to the below.
Rank (Expressions) | May 16 | June 16 | July 16 | ||
|---|---|---|---|---|---|
| QUESTIONS NO ANSWERS POS 1 | NOT HAPPY WITH SERVICE | ITS TOO COLD | TOO MANY LIGHTS OUT | ||
QUESTIONS NO ANSWERS POS 2 | TOO MANY LIGHTS OUT | NOT HAPPY WITH SERVICE | ITS TOO COLD | ||
| QUESTIONS NO ANSWERS POS 3 | ITS TOO COLD | TOO MANY LIGHTS OUT | NOT HAPPY WITH SERVICE | ||
| QUESTIONS NO ANSWERS POS 4 | THE STATIONERY IS CHEEP | WE RAN OUT OF COFFEE | THE STATIONERY IS CHEEP | ||
| QUESTIONS NO ANSWERS POS 5 | WE RAN OUT OF COFFEE | THE STATIONERY IS CHEEP | WE RAN OUT OF COFFEE | ||
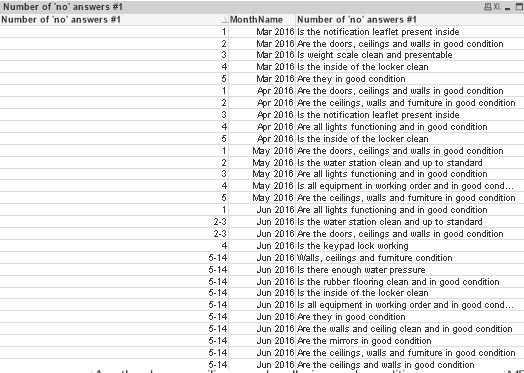
I assume this has something to do with the aggregation and the like my best efforts so far have resulted in the below straight table
Dimensions:
MonthName
Question (Hidden)
Expression:
IF(Rank(Aggr(Count({<Answer={'No'},User={'*'}-{'Nathalie','Natalie','Emanuele','Anthony'}>}QUESTION),QUESTION,MonthName))<=5,Rank(Aggr(Count({<Answer={'No'},User={'*'}-{'Nathalie','Natalie','Emanuele','Anthony'}>}QUESTION),QUESTION,MonthName)))
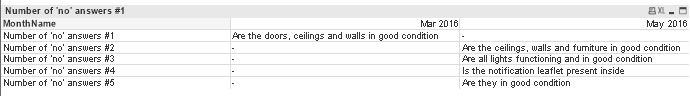
And this table
Dimension
MonthName
Expressions
Only(if(aggr(Rank(Count({<Answer={'No'},User={'*'}-{'Nathalie','Natalie','Emanuele','Anthony'}>}QUESTION))=1,QUESTION ),QUESTION))
Only(if(aggr(Rank(Count({<Answer={'No'},User={'*'}-{'Nathalie','Natalie','Emanuele','Anthony'}>}QUESTION))=2,QUESTION ),QUESTION))
Only(if(aggr(Rank(Count({<Answer={'No'},User={'*'}-{'Nathalie','Natalie','Emanuele','Anthony'}>}QUESTION))=3,QUESTION ),QUESTION))
etc....
The second table is closest to what I require however I am currently stuck for ideas as to how to make the expression pull out the questions against each month based on their rank.
Help please!!!!
- Mark as New
- Bookmark
- Subscribe
- Mute
- Subscribe to RSS Feed
- Permalink
- Report Inappropriate Content
Is this a QlikView or a Qlik Sense question (as you posted it in the wrong area)?
Let us know and we can move it to the right area so it get the right attention.
- Mark as New
- Bookmark
- Subscribe
- Mute
- Subscribe to RSS Feed
- Permalink
- Report Inappropriate Content
Hi it's a Qlikview question
- Mark as New
- Bookmark
- Subscribe
- Mute
- Subscribe to RSS Feed
- Permalink
- Report Inappropriate Content
HI David,
If I understand correctly you want your output to only display top 5 items by month like your first screenshot at the very top?
Could you provide a qvw so that I can try and assist you?
- Mark as New
- Bookmark
- Subscribe
- Mute
- Subscribe to RSS Feed
- Permalink
- Report Inappropriate Content
Hi,
Please see the attached.
David Chalkley
Manager
Deloitte LLP
Direct phone: +44 20 7007 1571 | Mobile: +44 7717 882246
dchalkley@deloitte.co.uk<mailto:dchalkley@deloitte.co.uk> | www.deloitte.co.uk<http://www.deloitte.co.uk/>
- Mark as New
- Bookmark
- Subscribe
- Mute
- Subscribe to RSS Feed
- Permalink
- Report Inappropriate Content
Can I ask you upload the excel file as well? So that I can do reloads, it seems this will have to be done in the backend