Unlock a world of possibilities! Login now and discover the exclusive benefits awaiting you.
- Qlik Community
- :
- All Forums
- :
- QlikView App Dev
- :
- How do you change the color of a trendline in a sc...
- Subscribe to RSS Feed
- Mark Topic as New
- Mark Topic as Read
- Float this Topic for Current User
- Bookmark
- Subscribe
- Mute
- Printer Friendly Page
- Mark as New
- Bookmark
- Subscribe
- Mute
- Subscribe to RSS Feed
- Permalink
- Report Inappropriate Content
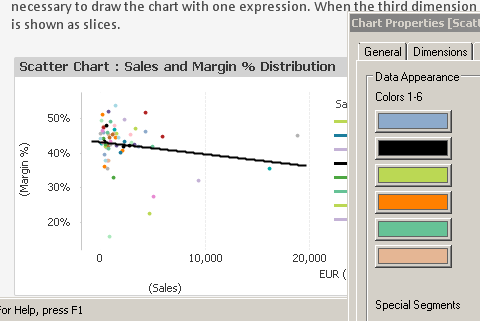
How do you change the color of a trendline in a scatter plot?
I'm trying to change the color of my scatter plot's trendline (attached a picture) from a teal color to just black. Is there a way to do this? Thank you!
- « Previous Replies
-
- 1
- 2
- Next Replies »
- Mark as New
- Bookmark
- Subscribe
- Mute
- Subscribe to RSS Feed
- Permalink
- Report Inappropriate Content
try to change in colors tab the second color to black
- Mark as New
- Bookmark
- Subscribe
- Mute
- Subscribe to RSS Feed
- Permalink
- Report Inappropriate Content
Hi Massimo,
The second color corresponds with one of my plotted points. Changing that color to black only changed one of my dots to black, not the trendline. Thanks anyway for your help.
- Mark as New
- Bookmark
- Subscribe
- Mute
- Subscribe to RSS Feed
- Permalink
- Report Inappropriate Content
could you post the doc?
- Mark as New
- Bookmark
- Subscribe
- Mute
- Subscribe to RSS Feed
- Permalink
- Report Inappropriate Content
try in the expression -under background color- use black(255)
- Mark as New
- Bookmark
- Subscribe
- Mute
- Subscribe to RSS Feed
- Permalink
- Report Inappropriate Content
In the Presentation tab > Reference Lines > change line formatting.
~Greg
- Mark as New
- Bookmark
- Subscribe
- Mute
- Subscribe to RSS Feed
- Permalink
- Report Inappropriate Content
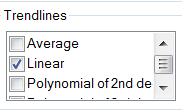
I didn't use a reference line, I added a linear trendline on the Expressions tab to the Y-axis expression.
- Mark as New
- Bookmark
- Subscribe
- Mute
- Subscribe to RSS Feed
- Permalink
- Report Inappropriate Content
Did you mean the expression that created the trendline? I created the line by checking the linear box under trendlines on the Expressions tab for my y-axis expression. I tried changing the background color in the expression that the trendline was for, but it still didn't do anything. Thank you for your help.
- Mark as New
- Bookmark
- Subscribe
- Mute
- Subscribe to RSS Feed
- Permalink
- Report Inappropriate Content
I can't it's private information and I don't know how to replicate it in a dummy QV file. Thank you.
- Mark as New
- Bookmark
- Subscribe
- Mute
- Subscribe to RSS Feed
- Permalink
- Report Inappropriate Content
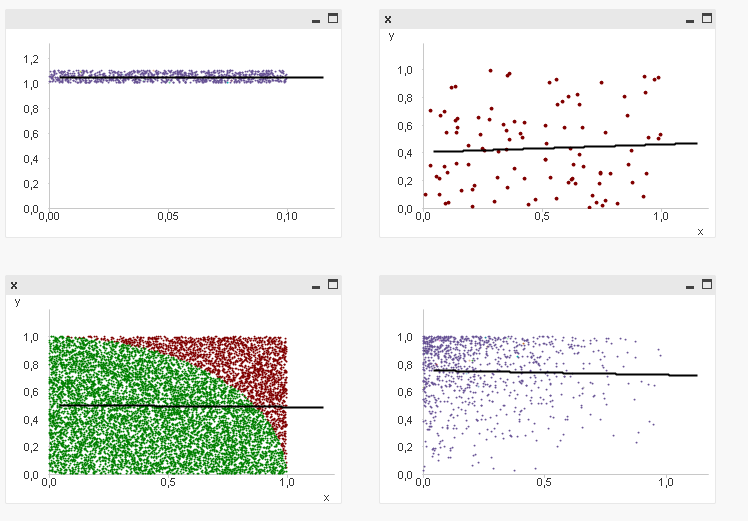
I try to post mine, see attachment
scatter with trendline black
- « Previous Replies
-
- 1
- 2
- Next Replies »