Unlock a world of possibilities! Login now and discover the exclusive benefits awaiting you.
- Qlik Community
- :
- All Forums
- :
- QlikView App Dev
- :
- How do you compute a period over period change on ...
- Subscribe to RSS Feed
- Mark Topic as New
- Mark Topic as Read
- Float this Topic for Current User
- Bookmark
- Subscribe
- Mute
- Printer Friendly Page
- Mark as New
- Bookmark
- Subscribe
- Mute
- Subscribe to RSS Feed
- Permalink
- Report Inappropriate Content
How do you compute a period over period change on a data series?
Hello,
I just loaded GDP data, but would like to view it as a $ change over time. How do I create such a measure?
Thank you,
Jessica
- Tags:
- new_to_qlikview
- « Previous Replies
-
- 1
- 2
- Next Replies »
Accepted Solutions
- Mark as New
- Bookmark
- Subscribe
- Mute
- Subscribe to RSS Feed
- Permalink
- Report Inappropriate Content
Well, usually you take the value of the current period and divide it by the value of the previous period and then subtract 1 from the result. Optionally you can format that result to show it as a percentage. Suppose you have MonthYear as dimension and the measure name is GDP_Amount. Your expression could be num(sum(GDP_Amount)/above(sum(GDP_Amount)) -1,'#.0%')
talk is cheap, supply exceeds demand
- Mark as New
- Bookmark
- Subscribe
- Mute
- Subscribe to RSS Feed
- Permalink
- Report Inappropriate Content
Thank you. This was very helpful. Is there a function directory somewhere? How did you know to use this expression?
- Mark as New
- Bookmark
- Subscribe
- Mute
- Subscribe to RSS Feed
- Permalink
- Report Inappropriate Content
It didn't work. There are no values created.
- Mark as New
- Bookmark
- Subscribe
- Mute
- Subscribe to RSS Feed
- Permalink
- Report Inappropriate Content
Please post a qlikview document that demonstrates the problem.
talk is cheap, supply exceeds demand
- Mark as New
- Bookmark
- Subscribe
- Mute
- Subscribe to RSS Feed
- Permalink
- Report Inappropriate Content
I'm not sure how to do that....I'm very new to this.
- Mark as New
- Bookmark
- Subscribe
- Mute
- Subscribe to RSS Feed
- Permalink
- Report Inappropriate Content
See this document: Preparing examples for Upload - Reduction and Data Scrambling
talk is cheap, supply exceeds demand
- Mark as New
- Bookmark
- Subscribe
- Mute
- Subscribe to RSS Feed
- Permalink
- Report Inappropriate Content
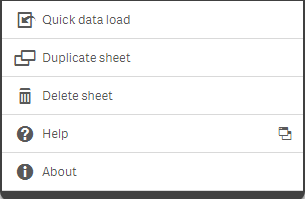
I clicked on the menu in the workbook and this is what I get. I don't see the File->Reduce Data ->Keep Possible Values as options. I'm wondering if I'm looking in the right place.
- Mark as New
- Bookmark
- Subscribe
- Mute
- Subscribe to RSS Feed
- Permalink
- Report Inappropriate Content
Actually, it worked. I needed to add brackets around the series.  Thank you!
- Mark as New
- Bookmark
- Subscribe
- Mute
- Subscribe to RSS Feed
- Permalink
- Report Inappropriate Content
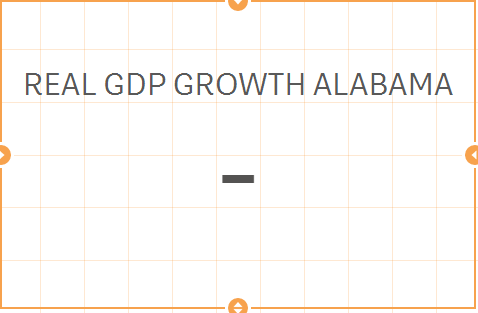
Ok, it works in a line graph, but not in a KPI- this is what I get.
- « Previous Replies
-
- 1
- 2
- Next Replies »