Unlock a world of possibilities! Login now and discover the exclusive benefits awaiting you.
- Qlik Community
- :
- All Forums
- :
- QlikView App Dev
- :
- How do you get the bars in a histogram to be betwe...
- Subscribe to RSS Feed
- Mark Topic as New
- Mark Topic as Read
- Float this Topic for Current User
- Bookmark
- Subscribe
- Mute
- Printer Friendly Page
- Mark as New
- Bookmark
- Subscribe
- Mute
- Subscribe to RSS Feed
- Permalink
- Report Inappropriate Content
How do you get the bars in a histogram to be between tick marks?
Hi,
This is a follow up to the file created here: http://community.qlik.com/message/435162#435162
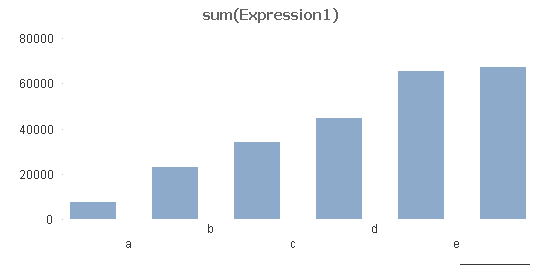
A histogram was built and I want to bars to be between the value marks and not on them, as is customary with histograms. Can you help?
Thanks 
- « Previous Replies
-
- 1
- 2
- Next Replies »
- Mark as New
- Bookmark
- Subscribe
- Mute
- Subscribe to RSS Feed
- Permalink
- Report Inappropriate Content
I don't think that is feasible with QV, the labels will be shown under the bars (as this is just a standard bar chart, not a kind of specialized histogram chart).
But you can change your labels for the bins to show the range, not only the min value, like
Bins:
LOAD Min, Max, Min &'-'& Max as Bin INLINE [
Min, Max
0, 49.99
50, 99.99
100, 149.99
150, 199.99
200, 249.99
250, 299.99
300, 349.99
350, 399.99
400, 449.99
450, 499.99
500,
];
- Mark as New
- Bookmark
- Subscribe
- Mute
- Subscribe to RSS Feed
- Permalink
- Report Inappropriate Content
thanks. I actually used the other format suggested, the one with expressions not with script loads
- Mark as New
- Bookmark
- Subscribe
- Mute
- Subscribe to RSS Feed
- Permalink
- Report Inappropriate Content
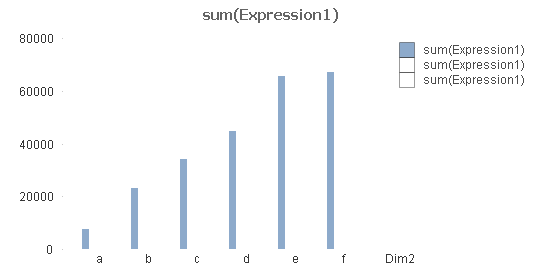
Try to duplicate your bar expression and mark the new one as transparent.
It´s not exactly centered, but maybe can fit your need
- Mark as New
- Bookmark
- Subscribe
- Mute
- Subscribe to RSS Feed
- Permalink
- Report Inappropriate Content
cute idea i hope there's a better way though.
thanks!
- Mark as New
- Bookmark
- Subscribe
- Mute
- Subscribe to RSS Feed
- Permalink
- Report Inappropriate Content
Another trick
Replace your dimension to a calculated one
=Repeat(' ',20) & Dim2
- Mark as New
- Bookmark
- Subscribe
- Mute
- Subscribe to RSS Feed
- Permalink
- Report Inappropriate Content
Hi,
The dimension is already a calculated dimension
=ValueList('0','50','100','150','200','250','300','350','400','450','500')
I tried to add another calculated dimension with
=Repeat(' ',20) & Bins
(bins is the label name I gave the above calculated dimension), but no success. I got a 'bad field name' notice
- Mark as New
- Bookmark
- Subscribe
- Mute
- Subscribe to RSS Feed
- Permalink
- Report Inappropriate Content
try
ValueList(' 0',' 50',' 100',' 150',' 200',' 250',' 300',' 350',' 400',' 450',' 500')
- Mark as New
- Bookmark
- Subscribe
- Mute
- Subscribe to RSS Feed
- Permalink
- Report Inappropriate Content
as the new dimension or instead of the original?
thanks
a
- Mark as New
- Bookmark
- Subscribe
- Mute
- Subscribe to RSS Feed
- Permalink
- Report Inappropriate Content
replace your dimension
=ValueList('0','50','100','150','200','250','300','350','400','450','500')
with
ValueList(' 0',' 50',' 100',' 150',' 200',' 250',' 300',' 350',' 400',' 450',' 500')
- « Previous Replies
-
- 1
- 2
- Next Replies »