Unlock a world of possibilities! Login now and discover the exclusive benefits awaiting you.
- Qlik Community
- :
- All Forums
- :
- QlikView App Dev
- :
- How to Calculate Sum of Volumes(Total) of all prod...
- Subscribe to RSS Feed
- Mark Topic as New
- Mark Topic as Read
- Float this Topic for Current User
- Bookmark
- Subscribe
- Mute
- Printer Friendly Page
- Mark as New
- Bookmark
- Subscribe
- Mute
- Subscribe to RSS Feed
- Permalink
- Report Inappropriate Content
How to Calculate Sum of Volumes(Total) of all products for a given Market in a Line Chart ?
I have line chart which has Volume in Y-Axis and Months as X-axis and showing the Volume trend for the different products in a given market. Now I want to show the total of all the products Volume in the same Line Chart.................... How could I do that???? Thanx in Advance............
Accepted Solutions
- Mark as New
- Bookmark
- Subscribe
- Mute
- Subscribe to RSS Feed
- Permalink
- Report Inappropriate Content
Hi Udaya,
Try to check <Show Total> in Dimension Limits tab (QV11)
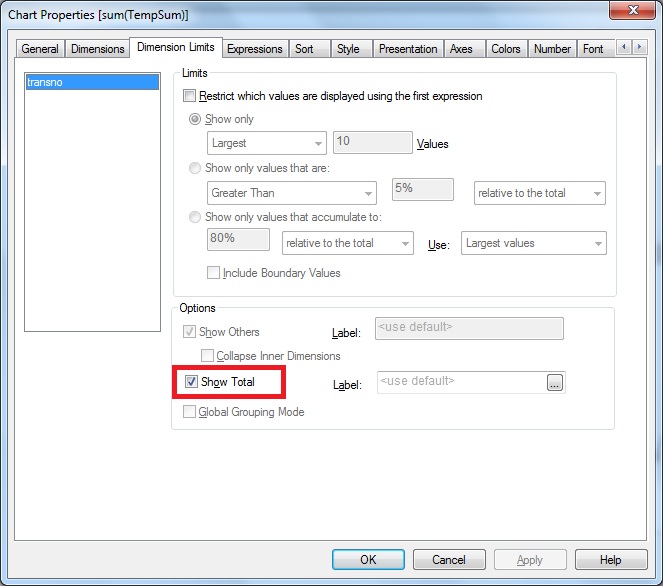
Let me know if this one you looking for.
Regards,
Sokkorn
- Mark as New
- Bookmark
- Subscribe
- Mute
- Subscribe to RSS Feed
- Permalink
- Report Inappropriate Content
Hi Udaya,
Try to check <Show Total> in Dimension Limits tab (QV11)
Let me know if this one you looking for.
Regards,
Sokkorn
- Mark as New
- Bookmark
- Subscribe
- Mute
- Subscribe to RSS Feed
- Permalink
- Report Inappropriate Content
Thanks Cheav...........Its working
- Mark as New
- Bookmark
- Subscribe
- Mute
- Subscribe to RSS Feed
- Permalink
- Report Inappropriate Content
How to add this TOTAL line in Qlik Sense Cloud version. I could not find any option.
We have a line chart with two dimensions and a measure as sum(charge), Need to add one more line that gives total charge for all products.
Please help