Unlock a world of possibilities! Login now and discover the exclusive benefits awaiting you.
- Qlik Community
- :
- All Forums
- :
- QlikView App Dev
- :
- Re: How to Change Report Layout(Chart Type) Run Ti...
- Subscribe to RSS Feed
- Mark Topic as New
- Mark Topic as Read
- Float this Topic for Current User
- Bookmark
- Subscribe
- Mute
- Printer Friendly Page
- Mark as New
- Bookmark
- Subscribe
- Mute
- Subscribe to RSS Feed
- Permalink
- Report Inappropriate Content
How to Change Report Layout(Chart Type) Run Time in Drill Down Group?
hello Dear,
I created a group of Dimension (year / Semester / Quarter / Month / Day) In Dimension Tab.

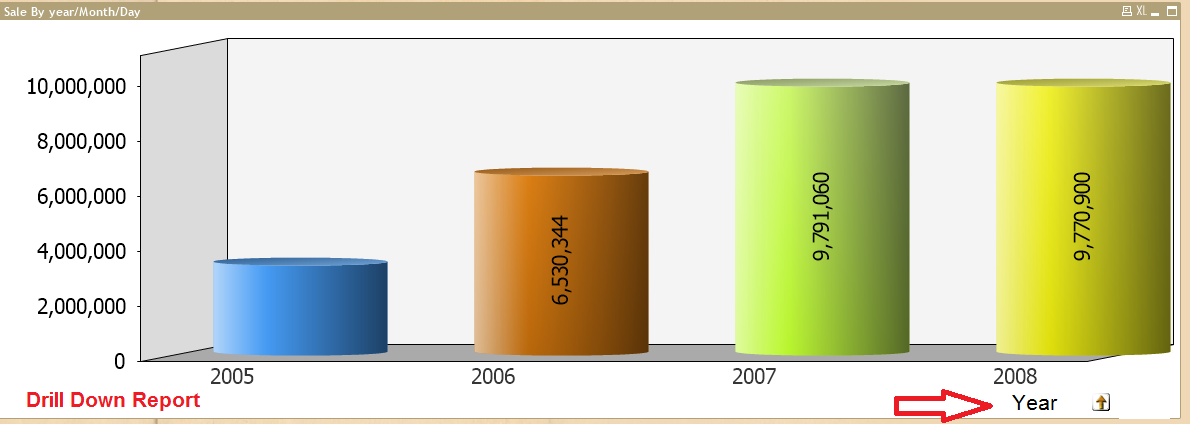
My Report Look Like :
Root Chart :

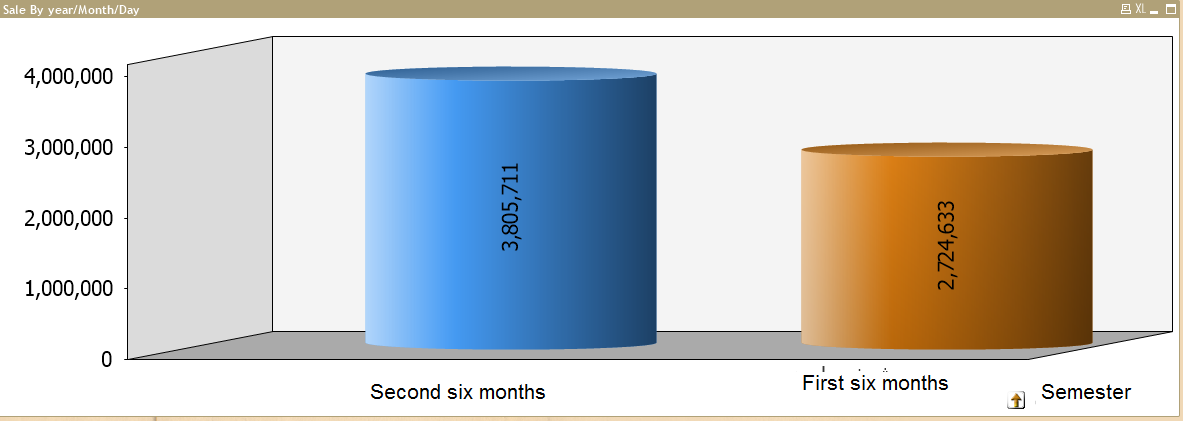
After Click On Year :
Show Report Per Semester Look Like
But This Phase ,I want Show Pie Chart Instead Of Bar Chart

But I'd then click chart type is changed (Change To PIE Chart)
I would like with every click chart type is changed
Accepted Solutions
- Mark as New
- Bookmark
- Subscribe
- Mute
- Subscribe to RSS Feed
- Permalink
- Report Inappropriate Content
- Mark as New
- Bookmark
- Subscribe
- Mute
- Subscribe to RSS Feed
- Permalink
- Report Inappropriate Content
That's not possible. But you can use two different charts and show/hide the correct one using a conditional display expression (on the Layout tab of the charts properties window) that uses the GetCurrentField function to check which field from the drill-down group is active.
talk is cheap, supply exceeds demand
- Mark as New
- Bookmark
- Subscribe
- Mute
- Subscribe to RSS Feed
- Permalink
- Report Inappropriate Content
Thanks Gysbert Wassenaar
Do You Have Sample GetCurrentField And Change Chart Per Group.?
- Mark as New
- Bookmark
- Subscribe
- Mute
- Subscribe to RSS Feed
- Permalink
- Report Inappropriate Content
See attached example.
talk is cheap, supply exceeds demand
- Mark as New
- Bookmark
- Subscribe
- Mute
- Subscribe to RSS Feed
- Permalink
- Report Inappropriate Content
Thanks