Unlock a world of possibilities! Login now and discover the exclusive benefits awaiting you.
- Qlik Community
- :
- All Forums
- :
- QlikView App Dev
- :
- Re: How to Consider Maximum Date in Each Month as ...
- Subscribe to RSS Feed
- Mark Topic as New
- Mark Topic as Read
- Float this Topic for Current User
- Bookmark
- Subscribe
- Mute
- Printer Friendly Page
- Mark as New
- Bookmark
- Subscribe
- Mute
- Subscribe to RSS Feed
- Permalink
- Report Inappropriate Content
How to Consider Maximum Date in Each Month as Dimension ?
Hi Frnz,
I would like to show monthly wise count({$<Aging_Category={'0-30'}>}Aging_Category).
but here i have to consider maximum date in each month. i.e.,
Jan - 31st [ Depends on my data ]
Feb - 28th
------
Please help me to write expression for that.
Here Dimension ==> Month
Expression ==> count({$<Aging_Category={'0-30'}>}Aging_Category)
- « Previous Replies
- Next Replies »
- Mark as New
- Bookmark
- Subscribe
- Mute
- Subscribe to RSS Feed
- Permalink
- Report Inappropriate Content
Hi,
I have attached qvw. Please find this.
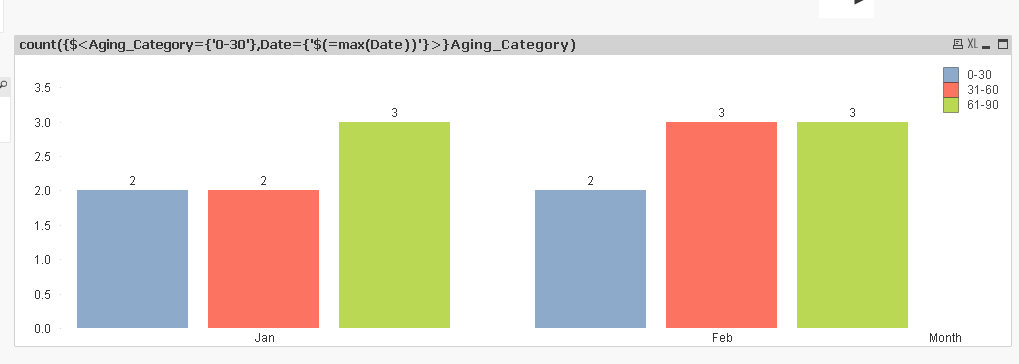
I have used this formulae : count({$<Aging_Category={'0-30'},Date={'$(=max(Date))'}>}Aging_Category).
This is working, but here it is showing only one month in dimension.
Can you please suggest, how to show all months in dimension.
- Mark as New
- Bookmark
- Subscribe
- Mute
- Subscribe to RSS Feed
- Permalink
- Report Inappropriate Content
Do you want this?
Expressions:
FirstSortedValue(Aggr(Count({$<Aging_Category={'0-30'}>}Aging_Category), Month, Date), -Aggr(Date, Month, Date))
FirstSortedValue(Aggr(Count({$<Aging_Category={'31-60'}>}Aging_Category), Month, Date), -Aggr(Date, Month, Date))
FirstSortedValue(Aggr(Count({$<Aging_Category={'61-90'}>}Aging_Category), Month, Date), -Aggr(Date, Month, Date))
- Mark as New
- Bookmark
- Subscribe
- Mute
- Subscribe to RSS Feed
- Permalink
- Report Inappropriate Content
Hi,
In that case try like this
Data:
LOAD
*,
MonthName(DateFieldName) AS MonthName,
FROM DataSource;
LEFT JOIN(Data)
LOAD
MonthName,
Max(DateFieldName) AS DateFieldName,
1 AS MaxDateInMonthFlag
Resident Data
Group By MonthName;
Now in your expression just use
Dimension = Month
Expression= count({$<Aging_Category={'0-30'}, MaxDateInMonthFlag={1}>}Aging_Category)
Hope this helps you.
Regards,
jagan.
- « Previous Replies
- Next Replies »