Unlock a world of possibilities! Login now and discover the exclusive benefits awaiting you.
- Qlik Community
- :
- All Forums
- :
- QlikView App Dev
- :
- Re: How to Create a % Change ROW in a Pivot table
- Subscribe to RSS Feed
- Mark Topic as New
- Mark Topic as Read
- Float this Topic for Current User
- Bookmark
- Subscribe
- Mute
- Printer Friendly Page
- Mark as New
- Bookmark
- Subscribe
- Mute
- Subscribe to RSS Feed
- Permalink
- Report Inappropriate Content
How to Create a % Change ROW in a Pivot table
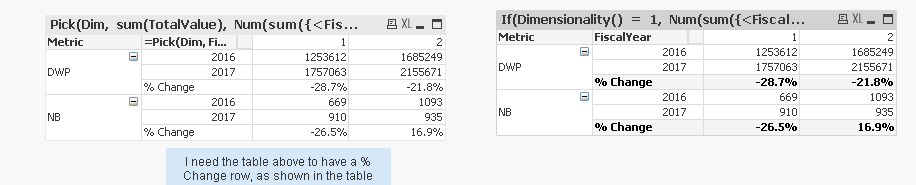
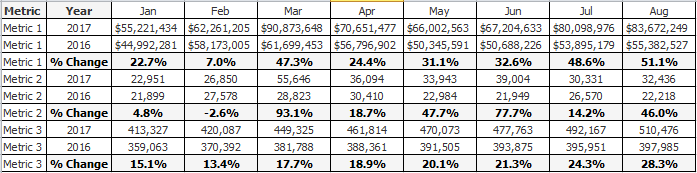
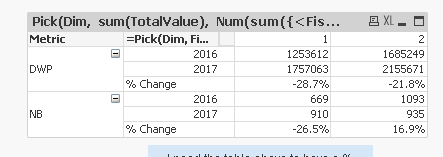
I need to create a row that displays the 2016 vs. 2017, % Change, by month. I can calculate the % Change and put it in a column all day long, but do not know how to make it a row (for each Metric).
Here is a sample of what I need. I have the pivot table created, just need the % Change row in bold. What would be the best way to go about this?
Thanks in advance,
Jason
Accepted Solutions
- Mark as New
- Bookmark
- Subscribe
- Mute
- Subscribe to RSS Feed
- Permalink
- Report Inappropriate Content
- Mark as New
- Bookmark
- Subscribe
- Mute
- Subscribe to RSS Feed
- Permalink
- Report Inappropriate Content
He created sample Re: Percentage Subtotal
- Mark as New
- Bookmark
- Subscribe
- Mute
- Subscribe to RSS Feed
- Permalink
- Report Inappropriate Content
Thank you. That's very helpful, but doesn't fit my requirements. I need to get the % change per dimension value, not of all values (Grand Totals) and percent of total.
Thank you for the reference though, I can see it coming in handy at some point down the road.
- Jason
- Mark as New
- Bookmark
- Subscribe
- Mute
- Subscribe to RSS Feed
- Permalink
- Report Inappropriate Content
May be share qvw file so then we can work for you 
- Mark as New
- Bookmark
- Subscribe
- Mute
- Subscribe to RSS Feed
- Permalink
- Report Inappropriate Content
Okay, here is a sample. Thank you for the help!
- Mark as New
- Bookmark
- Subscribe
- Mute
- Subscribe to RSS Feed
- Permalink
- Report Inappropriate Content
Check attached
- Mark as New
- Bookmark
- Subscribe
- Mute
- Subscribe to RSS Feed
- Permalink
- Report Inappropriate Content
My goodness, Sunny. That was fast. It looks to be exactly what I need! Going to spend some time figuring out what it does and implement it into the application. Will let you know if I run into anything.
Thank you!
- Mark as New
- Bookmark
- Subscribe
- Mute
- Subscribe to RSS Feed
- Permalink
- Report Inappropriate Content
There is this other option... but then the % change is highlighted in gray