Unlock a world of possibilities! Login now and discover the exclusive benefits awaiting you.
- Qlik Community
- :
- All Forums
- :
- QlikView App Dev
- :
- Re: How to Display >=10 Values in Pivot Table Colu...
- Subscribe to RSS Feed
- Mark Topic as New
- Mark Topic as Read
- Float this Topic for Current User
- Bookmark
- Subscribe
- Mute
- Printer Friendly Page
- Mark as New
- Bookmark
- Subscribe
- Mute
- Subscribe to RSS Feed
- Permalink
- Report Inappropriate Content
How to Display >=10 Values in Pivot Table Column?
Hi,
Any one Can Help me How to Display >10 Values in Pivot Table Column
my out put is
No.of Calls Call No >10 Calls
10 9966210476,9866210231 5,5
7 9876747466,7853464773 4,3
- Mark as New
- Bookmark
- Subscribe
- Mute
- Subscribe to RSS Feed
- Permalink
- Report Inappropriate Content
Sorry,
Try changing your Background Color Expression to:
=if(Sum(Expression)>=10,Red(),Black())
- Mark as New
- Bookmark
- Subscribe
- Mute
- Subscribe to RSS Feed
- Permalink
- Report Inappropriate Content
Hi,
I used Same Expression but Showing total row is Red
i need only >10 Calls only Red
Thanks,
Khasim.
- Mark as New
- Bookmark
- Subscribe
- Mute
- Subscribe to RSS Feed
- Permalink
- Report Inappropriate Content
It would help if you could post a sample app as we cannot see the problem...
- Mark as New
- Bookmark
- Subscribe
- Mute
- Subscribe to RSS Feed
- Permalink
- Report Inappropriate Content
Hi Julian,
I traied Somany Expressions but i didn't get Actual,
i want final out put is given below Screen, in this >3 Reminder Calls Column i want to display >3 value is RED
Ex: 1,2,2,2,5,7,8
Above Example i want to display 5,7,8 is show RED
you have any idea give me Suggession

Thanks,
Khasim.
- Mark as New
- Bookmark
- Subscribe
- Mute
- Subscribe to RSS Feed
- Permalink
- Report Inappropriate Content
Hi
Try changing your Background Color Expression to:
=if(Sum(Expression)>=10 and not Dimensionality()=0 ,Red(),Black())
- Mark as New
- Bookmark
- Subscribe
- Mute
- Subscribe to RSS Feed
- Permalink
- Report Inappropriate Content
Hi,
Expression Means Which one?
- Mark as New
- Bookmark
- Subscribe
- Mute
- Subscribe to RSS Feed
- Permalink
- Report Inappropriate Content
Backgroud expression

- Mark as New
- Bookmark
- Subscribe
- Mute
- Subscribe to RSS Feed
- Permalink
- Report Inappropriate Content
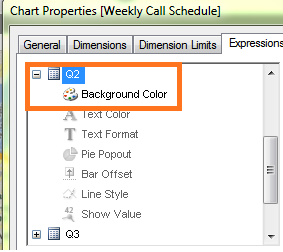
background expression
- Mark as New
- Bookmark
- Subscribe
- Mute
- Subscribe to RSS Feed
- Permalink
- Report Inappropriate Content
Hi Perumal,
I used This Expression
=
if(Concat({<ReminderDate= >}RemComplaintNo,';')>=4 and not Dimensionality()=0, Red(),Black())
but it showing total values are Red
- Mark as New
- Bookmark
- Subscribe
- Mute
- Subscribe to RSS Feed
- Permalink
- Report Inappropriate Content
Hi Perumal,
If We give in Back Ground Expression it shows Total Column Background is Red right?