Unlock a world of possibilities! Login now and discover the exclusive benefits awaiting you.
- Qlik Community
- :
- All Forums
- :
- QlikView App Dev
- :
- Re: How to Swap Legend and X axis by check box
- Subscribe to RSS Feed
- Mark Topic as New
- Mark Topic as Read
- Float this Topic for Current User
- Bookmark
- Subscribe
- Mute
- Printer Friendly Page
- Mark as New
- Bookmark
- Subscribe
- Mute
- Subscribe to RSS Feed
- Permalink
- Report Inappropriate Content
How to Swap Legend and X axis by check box
Hi ,
I have used 2 dimensions in my chart, and i am displaying Legends on same. I need a help to swap the legends as per the selection.
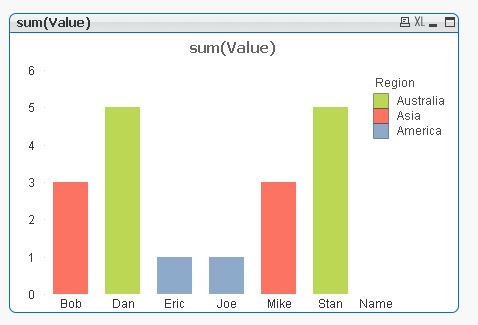
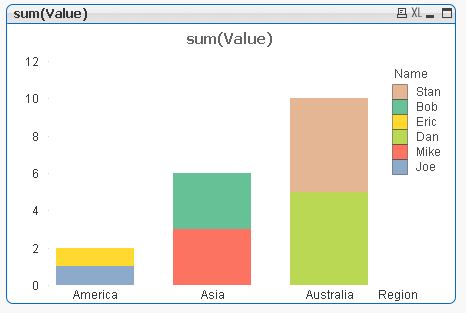
Eg: I have 2 dimensions like NAME and REGION, Now i have enabled Legends so REGION is displayed on X axis and NAME is displayed in Legends. I need a help that i will create a text box for NAME and REGION.
1.If i click on NAME (text box) NAME should be displayed on Legends and REGION should display in X axis.
2. If i click on REGION (text box) REGION should be display in Legend and NAME should display in X axis,
Please help me out.
Thanks
Varun K
Accepted Solutions
- Mark as New
- Bookmark
- Subscribe
- Mute
- Subscribe to RSS Feed
- Permalink
- Report Inappropriate Content
1. Create a variable with value 1. ex vNameRegion
2. Create a text object and click Actions-> Add->External-> Set Variable. In variable put vNameRegion. In value put 0. Add the text Name to the box.
3. Create another text object called Region and do the same thing but put the value as 1.
4. Create two charts with the dimensions switched, overlap them, and add a conditional in Object Properties-> Layout.
In the conditional add vNameRegion =1 for the first graph and vNameRegion=0 for the second graph (depending on the text objects).
I attached a sample.
- Mark as New
- Bookmark
- Subscribe
- Mute
- Subscribe to RSS Feed
- Permalink
- Report Inappropriate Content
Hi Pavan Amin,
Thanks for your replay, I have got the result as per the requirement.
I need one more help,
1. I have 3 to 4 Dimension like YEAR, MONTH, WEEK , DATE and MFG NAME in dimension and have some expression.
2. Now how can i apply your above rule for 3 to 4 dimension? I cannot break the dimensions as coz user selects any WEEK , MONTH or any DATE . I need to display as per his selection in single or multi charts.
Please let me know is there any other way to do it?
Thanks
- Mark as New
- Bookmark
- Subscribe
- Mute
- Subscribe to RSS Feed
- Permalink
- Report Inappropriate Content
I dont fully understand what you are trying to do. Could you try explaining it in a different way or show an image of what you are trying to do?
- Mark as New
- Bookmark
- Subscribe
- Mute
- Subscribe to RSS Feed
- Permalink
- Report Inappropriate Content
Hi Pavan,
Actually what you have answered is hide and show concept is working fine for 2 dimension used in the chart. I agree with you. But in my case i have almost 5 Dimension i have used in my chart for complete DATE, MONTH, YEAR and NAME as dimension.
As you can see i have these many dimension fields,
I just need to swap the legends.
As you have used hide show concept for 2 dimensions, I need to do it for all these above fields.
Thanks
Varun K
- Mark as New
- Bookmark
- Subscribe
- Mute
- Subscribe to RSS Feed
- Permalink
- Report Inappropriate Content
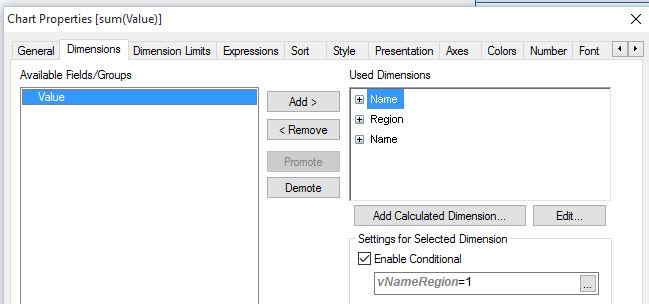
Something like this? Let me know if this helps. You can add the same Dimension multiple times by using add calculated dimension and putting it in the right position. The buttons next to the graph toggle the views.
- Mark as New
- Bookmark
- Subscribe
- Mute
- Subscribe to RSS Feed
- Permalink
- Report Inappropriate Content
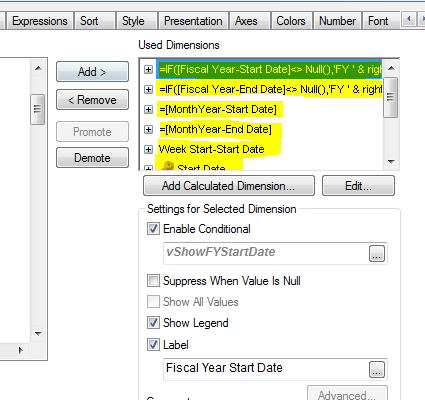
Hi,
instead of stacking charts you could also use conditionally enabled dimensions to generate different orders (using pavanamin example):
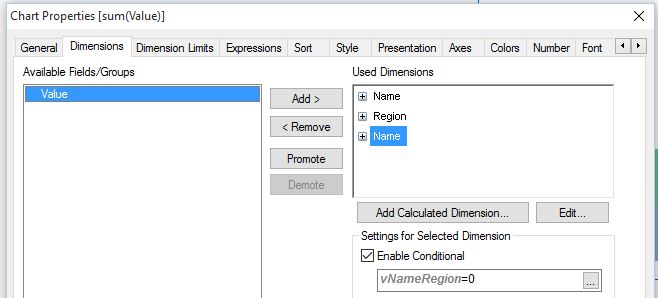
hope this helps
regards
Marco
- Mark as New
- Bookmark
- Subscribe
- Mute
- Subscribe to RSS Feed
- Permalink
- Report Inappropriate Content