Unlock a world of possibilities! Login now and discover the exclusive benefits awaiting you.
Announcements
Save an extra $150 Dec 1–7 with code CYBERWEEK - stackable with early bird savings: Register
- Qlik Community
- :
- All Forums
- :
- QlikView App Dev
- :
- How to: accumulated values in pivot table by month
Options
- Subscribe to RSS Feed
- Mark Topic as New
- Mark Topic as Read
- Float this Topic for Current User
- Bookmark
- Subscribe
- Mute
- Printer Friendly Page
Turn on suggestions
Auto-suggest helps you quickly narrow down your search results by suggesting possible matches as you type.
Showing results for
Creator III
2016-12-05
06:57 PM
- Mark as New
- Bookmark
- Subscribe
- Mute
- Subscribe to RSS Feed
- Permalink
- Report Inappropriate Content
How to: accumulated values in pivot table by month
Hi
Checking the Qlikview archives - this is close to what I want but not quite:
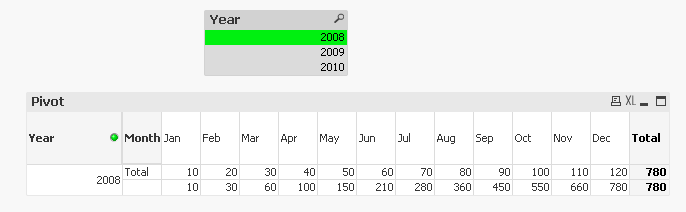
What I want is the figures as shown below and it to be a pivot table (does not have to be a pivot table - if there is some other way of getting the months to run horizontally rather than vertically.
Thank you
Jo
| Year | 2008 | 2008 |
| Month | Total | |
| Jan | 10 | 10 |
| Feb | 20 | 30 |
| Mar | 30 | 60 |
| Apr | 40 | 100 |
| May | 50 | 150 |
| Jun | 60 | 210 |
| Jul | 70 | 280 |
| Aug | 80 | 360 |
| Sep | 90 | 450 |
| Oct | 100 | 550 |
| Nov | 110 | 660 |
| Dec | 120 | 780 |
| Total | 780 | 780 |
| Year | Month | Jan | Feb | Mar | Apr | May | Jun | Jul | Aug | Sep | Oct | Nov | Dec | Total |
| 2008 | Total | 10 | 20 | 30 | 40 | 50 | 60 | 70 | 80 | 90 | 100 | 110 | 120 | 780 |
| 2008 | 10 | 30 | 60 | 100 | 150 | 210 | 280 | 360 | 450 | 550 | 660 | 780 | 780 |
- Tags:
- accumulation
1,353 Views
1 Solution
Accepted Solutions
MVP
2016-12-05
09:47 PM
- Mark as New
- Bookmark
- Subscribe
- Mute
- Subscribe to RSS Feed
- Permalink
- Report Inappropriate Content
1,225 Views
2 Replies
MVP
2016-12-05
09:47 PM
- Mark as New
- Bookmark
- Subscribe
- Mute
- Subscribe to RSS Feed
- Permalink
- Report Inappropriate Content
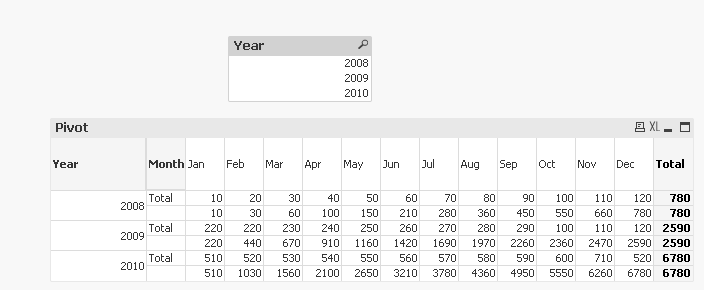
You want something like this?
Without selection
1,226 Views
Creator III
2016-12-05
11:02 PM
Author
- Mark as New
- Bookmark
- Subscribe
- Mute
- Subscribe to RSS Feed
- Permalink
- Report Inappropriate Content
yes - exactly right ... thank you
Jo
1,225 Views