Unlock a world of possibilities! Login now and discover the exclusive benefits awaiting you.
- Qlik Community
- :
- All Forums
- :
- QlikView App Dev
- :
- Re: How to achieve values in a linear gauge repres...
- Subscribe to RSS Feed
- Mark Topic as New
- Mark Topic as Read
- Float this Topic for Current User
- Bookmark
- Subscribe
- Mute
- Printer Friendly Page
- Mark as New
- Bookmark
- Subscribe
- Mute
- Subscribe to RSS Feed
- Permalink
- Report Inappropriate Content
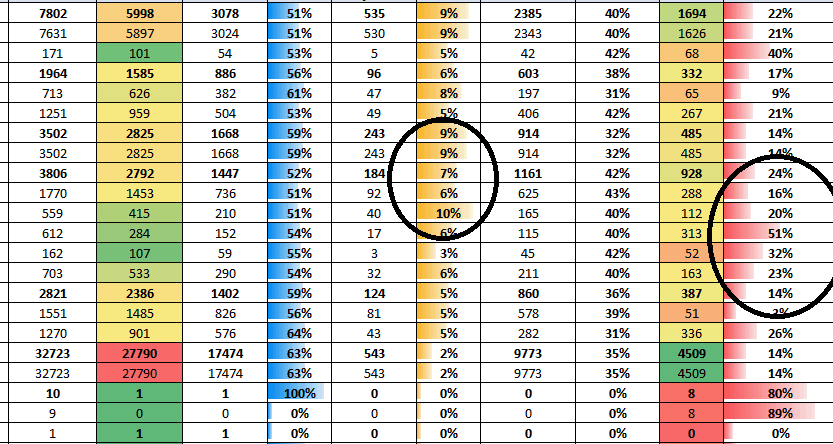
How to achieve values in a linear gauge representation in a straight table
Hi Experts,
I want achieve something which is commonly expressed in excel charts which are something like linear gauge representation with values in it . I know that i can create something like this with a straight table and choosing representation as linear guage , but i cannot get the values on it . Is there a way to achieve this output .
Regards,
Nadeem Shaikh
- Mark as New
- Bookmark
- Subscribe
- Mute
- Subscribe to RSS Feed
- Permalink
- Report Inappropriate Content
!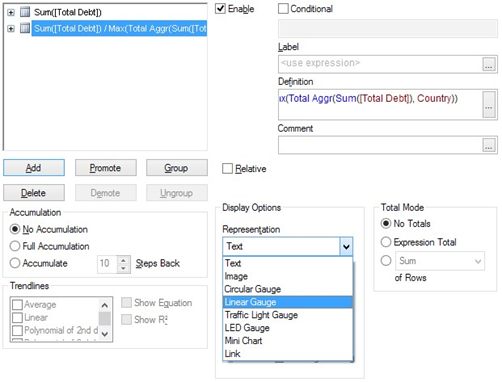
Have you checked with "Total Mode" ? If it is in "No totals" , you can not see any numbers or percentages on the graphs
- Mark as New
- Bookmark
- Subscribe
- Mute
- Subscribe to RSS Feed
- Permalink
- Report Inappropriate Content
Nope I have made it to expression total but it would give the expression total also in the linear gauge form .
I want the value represented by the linear gauge to show on the linear guage itself.
Regards
- Mark as New
- Bookmark
- Subscribe
- Mute
- Subscribe to RSS Feed
- Permalink
- Report Inappropriate Content
you need to make two charts.
one chart that only contains the gauges and the second chart only containing the values. then you need to make backround of the second chart transparent and place it on top of the first chart.
hope this helps
- Mark as New
- Bookmark
- Subscribe
- Mute
- Subscribe to RSS Feed
- Permalink
- Report Inappropriate Content
how did you find a solution?