Unlock a world of possibilities! Login now and discover the exclusive benefits awaiting you.
- Qlik Community
- :
- All Forums
- :
- QlikView App Dev
- :
- How to add Line % in Chart Grid
Options
- Subscribe to RSS Feed
- Mark Topic as New
- Mark Topic as Read
- Float this Topic for Current User
- Bookmark
- Subscribe
- Mute
- Printer Friendly Page
Turn on suggestions
Auto-suggest helps you quickly narrow down your search results by suggesting possible matches as you type.
Showing results for
Not applicable
2014-07-07
01:26 AM
- Mark as New
- Bookmark
- Subscribe
- Mute
- Subscribe to RSS Feed
- Permalink
- Report Inappropriate Content
How to add Line % in Chart Grid
Hi,
Can any one tell me how do I trill down the % shows in Y axes in the attached image
in the image its shows 20% , 40%, 60% but I want to change it as 5%, 10% , 15% I mean by 5 by
can any one help me on this
750 Views
1 Solution
Accepted Solutions
Not applicable
2014-07-07
01:30 AM
Author
- Mark as New
- Bookmark
- Subscribe
- Mute
- Subscribe to RSS Feed
- Permalink
- Report Inappropriate Content
683 Views
3 Replies
Not applicable
2014-07-07
01:30 AM
Author
- Mark as New
- Bookmark
- Subscribe
- Mute
- Subscribe to RSS Feed
- Permalink
- Report Inappropriate Content
Try like this
684 Views
Not applicable
2014-07-07
01:31 AM
Author
- Mark as New
- Bookmark
- Subscribe
- Mute
- Subscribe to RSS Feed
- Permalink
- Report Inappropriate Content
Hi,
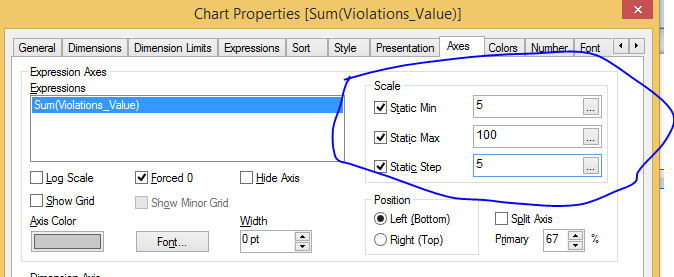
you can change that in properties - axes - scale
Not applicable
2014-07-07
01:49 AM
Author
- Mark as New
- Bookmark
- Subscribe
- Mute
- Subscribe to RSS Feed
- Permalink
- Report Inappropriate Content
Thanks you! yeah I have been trying that but the problem is if I do so
5 - 100 - 5 scale is go down and values getting merged if I add less values vales are go up
683 Views