Unlock a world of possibilities! Login now and discover the exclusive benefits awaiting you.
- Qlik Community
- :
- All Forums
- :
- QlikView App Dev
- :
- Re: How to add a grouped value field to the same f...
- Subscribe to RSS Feed
- Mark Topic as New
- Mark Topic as Read
- Float this Topic for Current User
- Bookmark
- Subscribe
- Mute
- Printer Friendly Page
- Mark as New
- Bookmark
- Subscribe
- Mute
- Subscribe to RSS Feed
- Permalink
- Report Inappropriate Content
How to add a grouped value field to the same field in script
Hi,
To better explain my question, I will use an example:
Table: Events
Field: ItemCode ; Values: A, B, C, D
Field: Expenses ; Values: 1, 2, 3, 4
I would like to add 'ALL' as an ItemCode and the sum of A,B,C,D expenses as it's Expenses value.
So my result would be:
Field: ItemCode ; Values: A, B, C, D, ALL
Field: Expenses ; Values: 1, 2, 3, 4, 10
What would the script look like for this?
Thanks,
Ben
- « Previous Replies
-
- 1
- 2
- Next Replies »
Accepted Solutions
- Mark as New
- Bookmark
- Subscribe
- Mute
- Subscribe to RSS Feed
- Permalink
- Report Inappropriate Content
Perhaps you should create a new table with a new ReportItemCode field and use that field as chart dimension
NewTable:
LOAD
FieldValue('ItemCode', RecNo()) as ReportItemCode,
FieldValue('ItemCode', RecNo()) as ItemCode
AutoGenerate FieldValueCount('ItemCode')
;
CONCATENATE (NewTable)
LOAD * INLINE [
ReportItemCode, ItemCode
ALL, A
ALL, B
ALL, C
ALL, D
];
talk is cheap, supply exceeds demand
- Mark as New
- Bookmark
- Subscribe
- Mute
- Subscribe to RSS Feed
- Permalink
- Report Inappropriate Content
Like this:
Table:
LOAD ItemCode, Expenses FROM ... ;
CONCATENATE (Table)
LOAD 'ALL' as ItemCode, sum(Expenses) as Expenses RESIDENT Table;
talk is cheap, supply exceeds demand
- Mark as New
- Bookmark
- Subscribe
- Mute
- Subscribe to RSS Feed
- Permalink
- Report Inappropriate Content
This is what I'm looking for, but I forgot to mention that there are more than just those ItemCodes, Example:
ItemCode: A, B, C, D, E, F
Values: 1, 2, 3, 4, 5, 6
I want 'ALL' to just consist of A, B, C, D; So I want:
ItemCode: A, B, C, D, ALL, E, F
Values: 1, 2, 3, 4, 10, 5, 6
- Mark as New
- Bookmark
- Subscribe
- Mute
- Subscribe to RSS Feed
- Permalink
- Report Inappropriate Content
Change the second load to:
LOAD 'ALL' as ItemCode, sum(Expenses) as Expenses RESIDENT Table WHERE Match(ItemCode, 'A','B','C','D');
talk is cheap, supply exceeds demand
- Mark as New
- Bookmark
- Subscribe
- Mute
- Subscribe to RSS Feed
- Permalink
- Report Inappropriate Content
This works for my example, but my example may have been too simple - let me go into further detail:
I have other fields that this field is being filtered on, for example my set analysis is:
| sum({< | MTGStatus = {'ASSIGNED','CLOSED','CLOSED BY FINANCE', |
'LOGISTICS CONFIRMED','PENDING/REP','PENDING/SPEAKER','PENDING/VENUE',
'PROGRAM OCCURRED','RECONCILED', 'REQUESTED BY REP'},
MTGDate = {">=$(=yearstart(today()))"} >} Expenses)
And the first Dimension is Division - my 2nd Dimension is ItemCode
These fields are all in the same table, can this be done?
- Mark as New
- Bookmark
- Subscribe
- Mute
- Subscribe to RSS Feed
- Permalink
- Report Inappropriate Content
Hi,
why are you looking for a script solution?
Maybe you just could use a total label to get a table like this (eventually restricting the sum function with your existing set expression)?
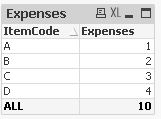
hope this helps
regards
Marco
- Mark as New
- Bookmark
- Subscribe
- Mute
- Subscribe to RSS Feed
- Permalink
- Report Inappropriate Content
I have bar chart with grouped style ('stacked' would do exactly what I want, but it is desired to be grouped style), in Qlik Sense, and I'm trying to display a total sum for each group in addition to showing the other bars grouped with it. In QlikSense it will only allow one expression with 2 dimensions.
- Mark as New
- Bookmark
- Subscribe
- Mute
- Subscribe to RSS Feed
- Permalink
- Report Inappropriate Content
Perhaps you should create a new table with a new ReportItemCode field and use that field as chart dimension
NewTable:
LOAD
FieldValue('ItemCode', RecNo()) as ReportItemCode,
FieldValue('ItemCode', RecNo()) as ItemCode
AutoGenerate FieldValueCount('ItemCode')
;
CONCATENATE (NewTable)
LOAD * INLINE [
ReportItemCode, ItemCode
ALL, A
ALL, B
ALL, C
ALL, D
];
talk is cheap, supply exceeds demand
- Mark as New
- Bookmark
- Subscribe
- Mute
- Subscribe to RSS Feed
- Permalink
- Report Inappropriate Content
For some reason I'm getting an error with your script? 
- Mark as New
- Bookmark
- Subscribe
- Mute
- Subscribe to RSS Feed
- Permalink
- Report Inappropriate Content
And you want me to guess the error message? No thanks, not interested 
Ok, one guess. You replaced your entire script with the bit I posted instead of appending it to your existing script. The part I posted does need the table with the regular ItemCode field to exist already.
talk is cheap, supply exceeds demand
- « Previous Replies
-
- 1
- 2
- Next Replies »