Unlock a world of possibilities! Login now and discover the exclusive benefits awaiting you.
- Qlik Community
- :
- All Forums
- :
- QlikView App Dev
- :
- Re: How to add a line chart into scatter chart
Options
- Subscribe to RSS Feed
- Mark Topic as New
- Mark Topic as Read
- Float this Topic for Current User
- Bookmark
- Subscribe
- Mute
- Printer Friendly Page
Turn on suggestions
Auto-suggest helps you quickly narrow down your search results by suggesting possible matches as you type.
Showing results for
Not applicable
2015-11-24
10:49 AM
- Mark as New
- Bookmark
- Subscribe
- Mute
- Subscribe to RSS Feed
- Permalink
- Report Inappropriate Content
How to add a line chart into scatter chart
How to add a line chart into scatter chart
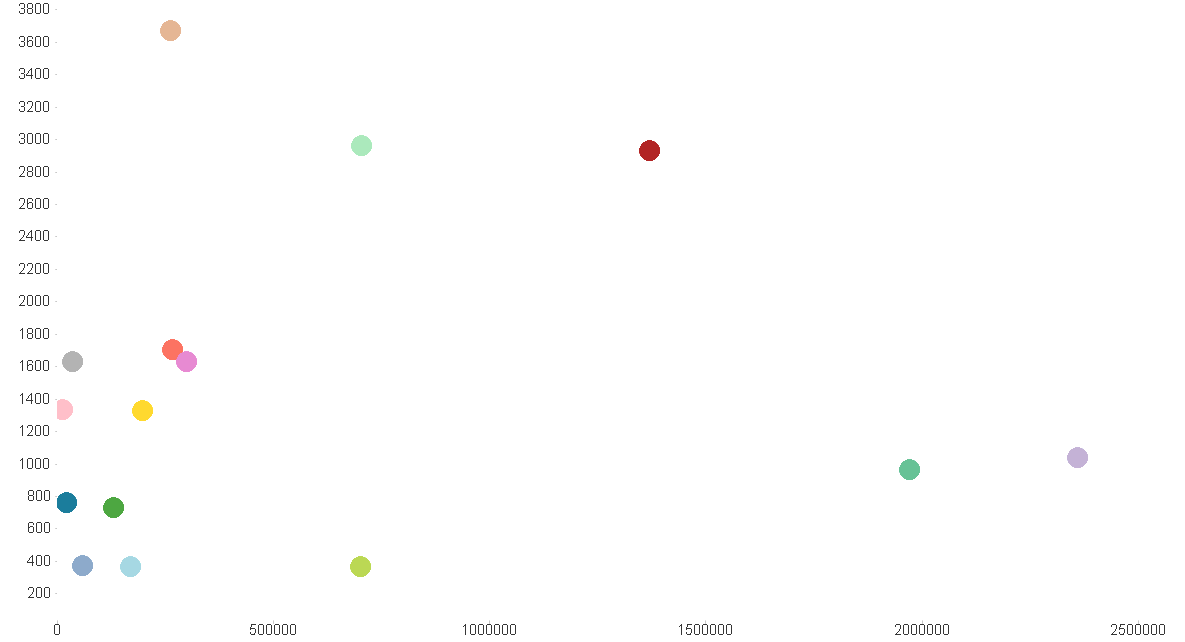
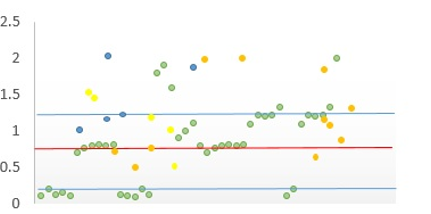
Need to show line in scatter chart but cant add another dimension. I would like to show like a bottom chart.
Thanks
- Tags:
- new_to_qlikview
566 Views
3 Replies
MVP
2015-11-24
07:00 PM
- Mark as New
- Bookmark
- Subscribe
- Mute
- Subscribe to RSS Feed
- Permalink
- Report Inappropriate Content
Have a look at chart properties - presentation tab - reference lines.
Here you can add reference lines for y and / or x axis positions.
Not applicable
2015-11-24
07:52 PM
Author
- Mark as New
- Bookmark
- Subscribe
- Mute
- Subscribe to RSS Feed
- Permalink
- Report Inappropriate Content
Thanks a lot swuehl That is correct answer, I did find it and its working.
Thanks
390 Views
Partner - Champion III
2015-11-24
08:20 PM
- Mark as New
- Bookmark
- Subscribe
- Mute
- Subscribe to RSS Feed
- Permalink
- Report Inappropriate Content
Hi,
You can try Reference line for this
Chart Properties -> Presentation -> Reference Lines -> Add -> Give your expression & Label
Check this link
QlikView - Reference Line - Basic.wmv - YouTube
Hope this helps you.
Regards,
jagan.