Unlock a world of possibilities! Login now and discover the exclusive benefits awaiting you.
- Qlik Community
- :
- All Forums
- :
- QlikView App Dev
- :
- How to add a linear function in graph
- Subscribe to RSS Feed
- Mark Topic as New
- Mark Topic as Read
- Float this Topic for Current User
- Bookmark
- Subscribe
- Mute
- Printer Friendly Page
- Mark as New
- Bookmark
- Subscribe
- Mute
- Subscribe to RSS Feed
- Permalink
- Report Inappropriate Content
How to add a linear function in graph
Hi,
I would like to add the linear regression y=x to my existing graph:
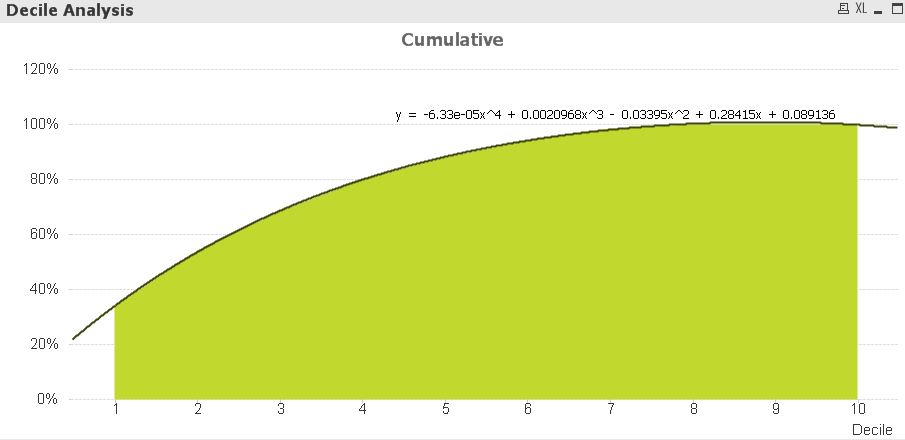
Also, would you know a way to calculate the area under the curve ?
Many thanks,
Lea
- Mark as New
- Bookmark
- Subscribe
- Mute
- Subscribe to RSS Feed
- Permalink
- Report Inappropriate Content
i do not think so , directly not possible..,so lets wait for some one reply
if u r asking any statistical tools (like R),so u can map and do whatever u need.
- Mark as New
- Bookmark
- Subscribe
- Mute
- Subscribe to RSS Feed
- Permalink
- Report Inappropriate Content
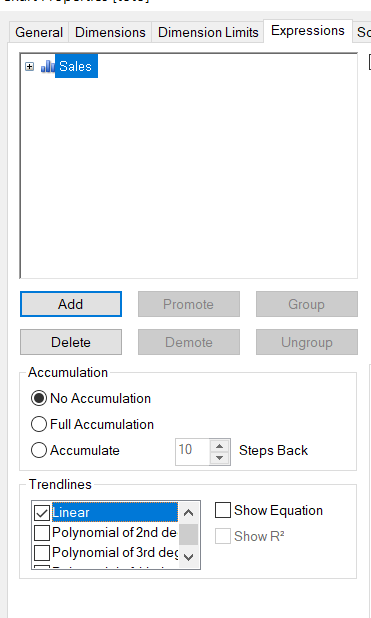
Hi, you can add linear function with Properties/Expressions/Trendlines
- Mark as New
- Bookmark
- Subscribe
- Mute
- Subscribe to RSS Feed
- Permalink
- Report Inappropriate Content
Hi,
I need to add the linear function x=y which is not connected to my expression.
I would like to create another linear trend in the same graph which is equal to:
X, Y,
0, 0%
1, 10%
2, 20%,
3, 30%,
4, 40%
5, 50%
6, 60%,
7, 70%,
8, 80%
9, 90%
10, 100%
- Mark as New
- Bookmark
- Subscribe
- Mute
- Subscribe to RSS Feed
- Permalink
- Report Inappropriate Content
Hi,
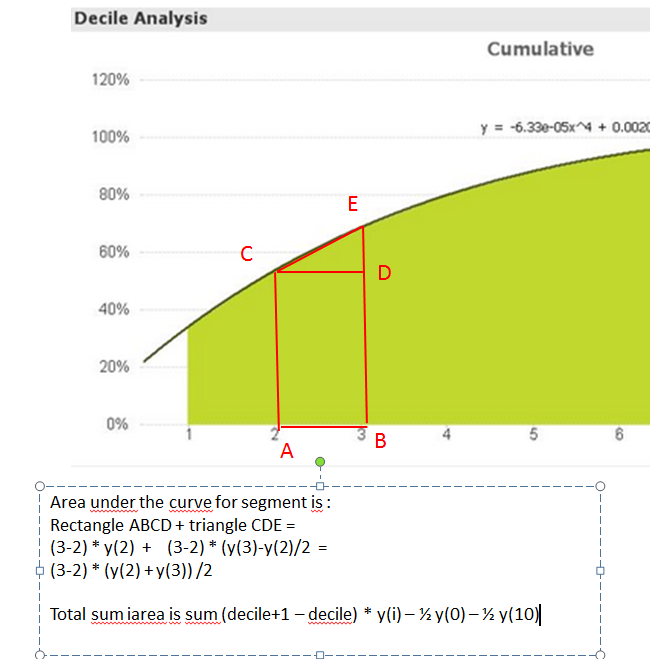
between two deciles :
the area (approx) is
(y + below(y))/2 * 1 ( 1 = diff between two decile)
you sum this expression and you have the area under the curve
if you want to do this for your linear regression : look at linest_ functions
you can use too 1/100 fractile to be more precise
regards
- Mark as New
- Bookmark
- Subscribe
- Mute
- Subscribe to RSS Feed
- Permalink
- Report Inappropriate Content
- Mark as New
- Bookmark
- Subscribe
- Mute
- Subscribe to RSS Feed
- Permalink
- Report Inappropriate Content
here is explanation of area calculation,
made it several times for lorentz/pareto curve or roc curve
for y=x
maybe somethink like (rowno -1) * 10 as far as X is 0 to 10 ?
tell me is that suit you