Unlock a world of possibilities! Login now and discover the exclusive benefits awaiting you.
- Qlik Community
- :
- All Forums
- :
- QlikView App Dev
- :
- Re: How to add avg comparison to chart
- Subscribe to RSS Feed
- Mark Topic as New
- Mark Topic as Read
- Float this Topic for Current User
- Bookmark
- Subscribe
- Mute
- Printer Friendly Page
- Mark as New
- Bookmark
- Subscribe
- Mute
- Subscribe to RSS Feed
- Permalink
- Report Inappropriate Content
How to add avg comparison to chart
Hi all,
Please have a look at my attached straight forward chart.
What I'd like to achieve is very simple. When I click on an employee, I want the chart to compare that employee to the average of all other employee's. Just not sure how to go about it.
Any help would be appreciated.
Kind Regards,
W
- Tags:
- new_to_qlikview
Accepted Solutions
- Mark as New
- Bookmark
- Subscribe
- Mute
- Subscribe to RSS Feed
- Permalink
- Report Inappropriate Content
I think Sunny is close, but one also must remove the currently selected Employee if you want the average of the others. I have modified Sunny's expression to inverse the selection on Employee.
Avg(TOTAL {<Employee = e(Employee)>} Aggr(sum({<Employee = e(Employee)>} CallHours), Month, Employee))
- Mark as New
- Bookmark
- Subscribe
- Mute
- Subscribe to RSS Feed
- Permalink
- Report Inappropriate Content
Something like this?
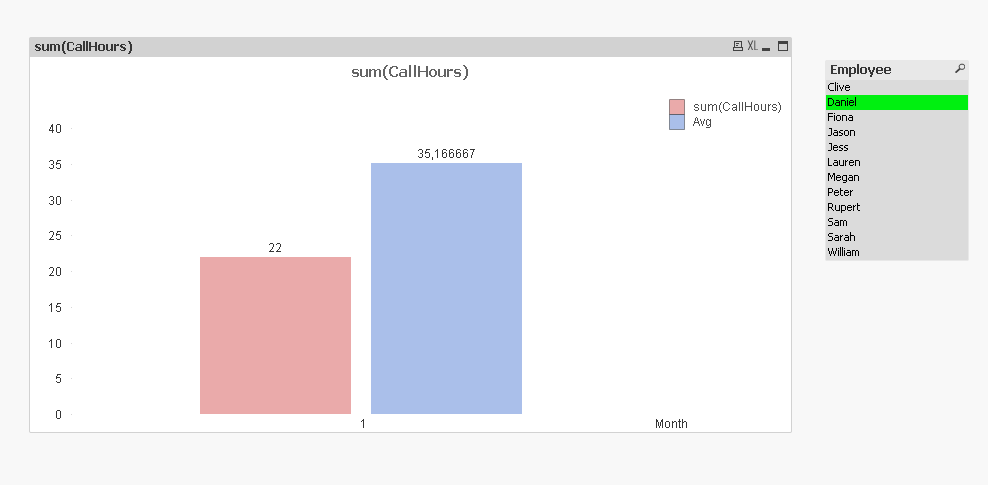
If it is, then I can explain you the changes I made to get to this. If not then help me understand exactly what you want.
Best,
Sunny
- Mark as New
- Bookmark
- Subscribe
- Mute
- Subscribe to RSS Feed
- Permalink
- Report Inappropriate Content
I think Sunny is close, but one also must remove the currently selected Employee if you want the average of the others. I have modified Sunny's expression to inverse the selection on Employee.
Avg(TOTAL {<Employee = e(Employee)>} Aggr(sum({<Employee = e(Employee)>} CallHours), Month, Employee))