Unlock a world of possibilities! Login now and discover the exclusive benefits awaiting you.
- Qlik Community
- :
- All Forums
- :
- QlikView App Dev
- :
- Re: How to add customized bar on top of stacked ch...
- Subscribe to RSS Feed
- Mark Topic as New
- Mark Topic as Read
- Float this Topic for Current User
- Bookmark
- Subscribe
- Mute
- Printer Friendly Page
- Mark as New
- Bookmark
- Subscribe
- Mute
- Subscribe to RSS Feed
- Permalink
- Report Inappropriate Content
How to add customized bar on top of stacked chart?
Hi all,
I have a time tracking dataset below indicating hours employee tracked per month:
| Month | Hour | Emp |
| July | 1 | A |
| July | 2 | A |
| July | 3 | B |
| July | 4 | C |
| August | 2 | A |
| August | 8 | B |
| August | 4 | B |
| August | 1 | C |
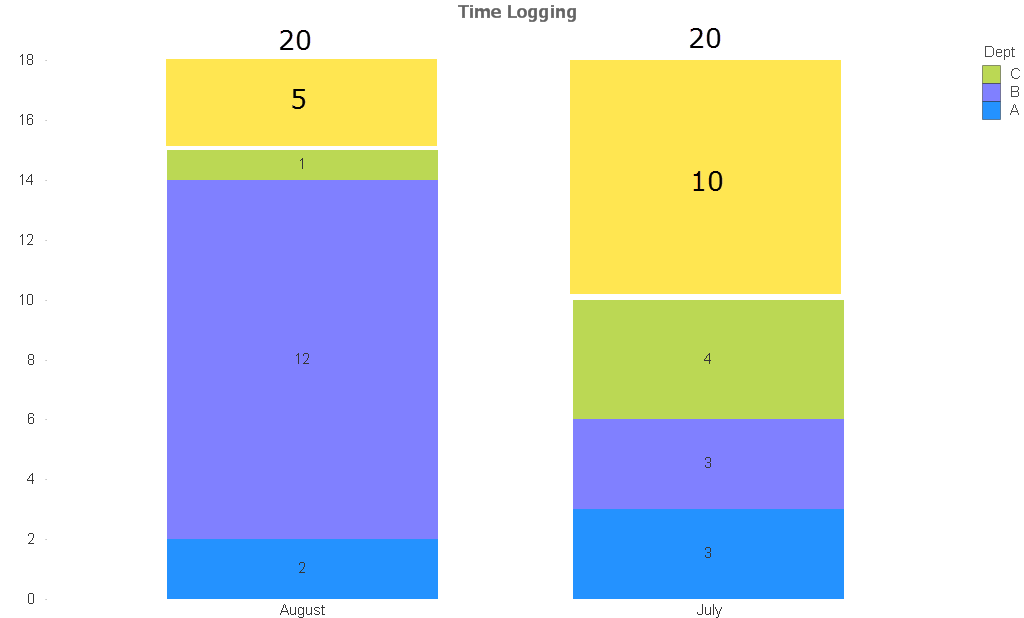
I made a stacked bar chart below:

I would like to add an additional bar on top of each bar to show untracked hours. In this case, all employees supposed to track 20 hours per month, so untracked hour for August is 5 and for July is 10.
Could anyone help me regarding how to add this bar?
Thanks,
Sherrie
Accepted Solutions
- Mark as New
- Bookmark
- Subscribe
- Mute
- Subscribe to RSS Feed
- Permalink
- Report Inappropriate Content
Inspired by Jean's answer, here is the answer to do it within same chart:
concatenate([TABLE1])
load
20-sum(Hour) as Untrackhours,
Month
Resident TABLE1
group by Month;
- Mark as New
- Bookmark
- Subscribe
- Mute
- Subscribe to RSS Feed
- Permalink
- Report Inappropriate Content
Hi,
I manage to get this in the attached file.
So create a second table with :
TABLE1:
LOAD * INLINE [
Month, Hour, Emp
July, 1, A
July, 2, A
July, 3, B
July, 4, C
August, 2, A
August, 8, B
August, 4, B
August, 1, C
];
TABLE2:
load
sum(Hour) as Totalhours,
20-sum(Hour) as Untrackhours,
Month
Resident TABLE1
group by Month;
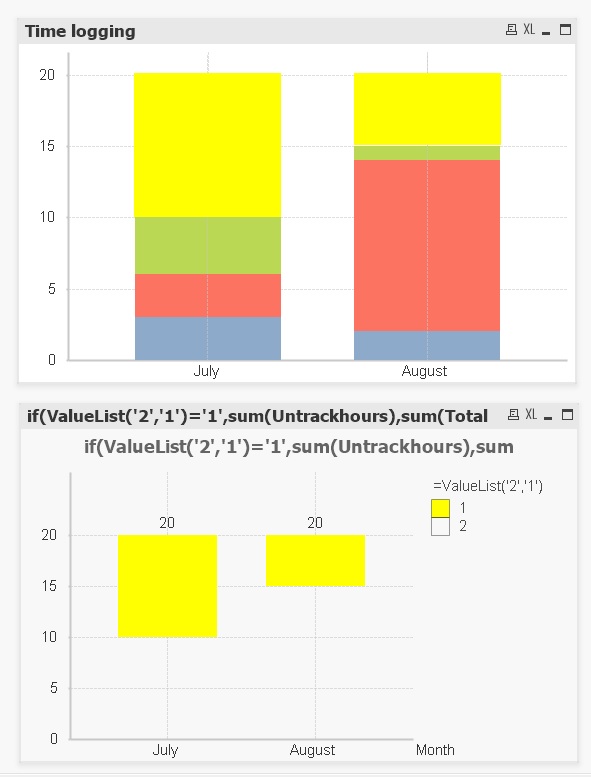
Create a second graph with:
dimensions : Month, Valuelist('2','1')
expression : if(ValueList('2','1')='1',sum(Untrackhours),sum(Totalhours))
Overlap the two graphs with transparent head, legend,... for the second graph wich contains realized Hours (transparent) and untracked hours (yellow).
Regards
- Mark as New
- Bookmark
- Subscribe
- Mute
- Subscribe to RSS Feed
- Permalink
- Report Inappropriate Content
Hi Jean,
Thanks for your answer, it works. But is there anyway to create within same chart rather than two different charts? My concern is that when user drill through one chart the other chart (untracked) portion will stay the same and become distracting.
Thanks,
Sherrie
- Mark as New
- Bookmark
- Subscribe
- Mute
- Subscribe to RSS Feed
- Permalink
- Report Inappropriate Content
And if it is not within same chart, I could not add 'untracked hour' as a legend to the chart.
- Mark as New
- Bookmark
- Subscribe
- Mute
- Subscribe to RSS Feed
- Permalink
- Report Inappropriate Content
Inspired by Jean's answer, here is the answer to do it within same chart:
concatenate([TABLE1])
load
20-sum(Hour) as Untrackhours,
Month
Resident TABLE1
group by Month;