Unlock a world of possibilities! Login now and discover the exclusive benefits awaiting you.
- Qlik Community
- :
- All Forums
- :
- QlikView App Dev
- :
- How to add % of total in Pie chart?
- Subscribe to RSS Feed
- Mark Topic as New
- Mark Topic as Read
- Float this Topic for Current User
- Bookmark
- Subscribe
- Mute
- Printer Friendly Page
- Mark as New
- Bookmark
- Subscribe
- Mute
- Subscribe to RSS Feed
- Permalink
- Report Inappropriate Content
How to add % of total in Pie chart?
Hi There,
In the Pie chart, can display the categories of absolute values, I want to add percentage of total.
Thank you in advance!
- Mark as New
- Bookmark
- Subscribe
- Mute
- Subscribe to RSS Feed
- Permalink
- Report Inappropriate Content
HI bing bin,
you could do something like the attached:
Remove the Demand Qty dimension and add it as Text In Chart, then change you expression to display as relative
HTH
Andy
- Mark as New
- Bookmark
- Subscribe
- Mute
- Subscribe to RSS Feed
- Permalink
- Report Inappropriate Content
Hi bing ,
check attached
- Mark as New
- Bookmark
- Subscribe
- Mute
- Subscribe to RSS Feed
- Permalink
- Report Inappropriate Content
Hi Andy,
thank you for your help.
since I am a beginner, could you please tell me the specific action steps with images?
thank you in advance!
- Mark as New
- Bookmark
- Subscribe
- Mute
- Subscribe to RSS Feed
- Permalink
- Report Inappropriate Content
Hi bing bin,
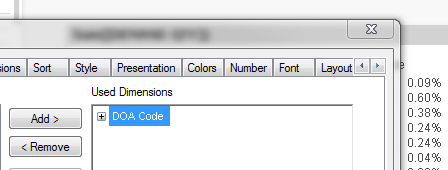
1. Open Chart Properties> Dimension and remove the Demand Qty Dimension.
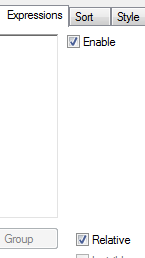
2. Open Expressions and click relative, this enables the % values in the Legend
3. Open Presentation > Text In Chart > Add, enter the following in the Text field:
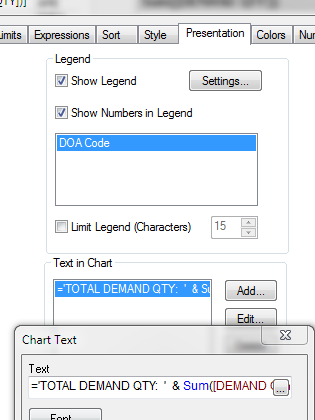
'TOTAL DEMAND QTY: ' & Sum([DEMAND QTY])
click Font and set the font size and bold if required
4. Use the keystrokes CTRL+Shift, red lines will appear around the various elements of the chart, keep them pressed and click and drag the 'text in chart' to the desired location.
Andy
- Mark as New
- Bookmark
- Subscribe
- Mute
- Subscribe to RSS Feed
- Permalink
- Report Inappropriate Content
Hi Andy,
I got it, thank you so much for help!
- Mark as New
- Bookmark
- Subscribe
- Mute
- Subscribe to RSS Feed
- Permalink
- Report Inappropriate Content
HI Bing Bin,
glad I could help, if you are happy with the reply, please mark it as CORRECT 
This helps other community members!
Andy