Unlock a world of possibilities! Login now and discover the exclusive benefits awaiting you.
- Qlik Community
- :
- All Forums
- :
- QlikView App Dev
- :
- How to add $ sign in Y-axis in bar Chart
- Subscribe to RSS Feed
- Mark Topic as New
- Mark Topic as Read
- Float this Topic for Current User
- Bookmark
- Subscribe
- Mute
- Printer Friendly Page
- Mark as New
- Bookmark
- Subscribe
- Mute
- Subscribe to RSS Feed
- Permalink
- Report Inappropriate Content
How to add $ sign in Y-axis in bar Chart
Hi All,
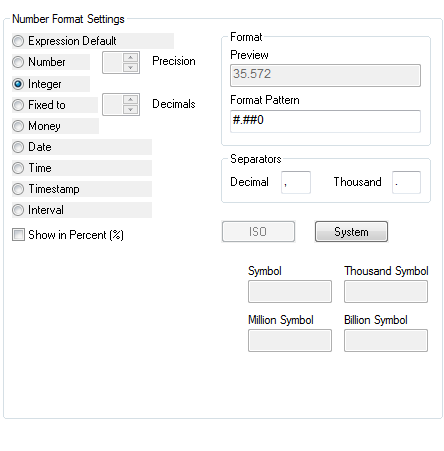
I have required $ in the y-axis scale. Here in the expression already i have given money function with format i.e '($#,##0)' and also in the number properties i have given fixed with two decimals with $ sign but still it is not showing.
Please find the images in the below.
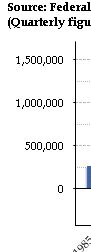
the below image is when you click on anually the scale should be shown as $1,500,000 and soon.
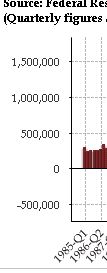
the below image is when you click on Quarterly the scale should be shown as $1,500,000 and soon.
Please let me know on this. But i have tried with all properties in the number properties in chart but no results found.
Thanks
Avinash
Accepted Solutions
- Mark as New
- Bookmark
- Subscribe
- Mute
- Subscribe to RSS Feed
- Permalink
- Report Inappropriate Content
HI,
You can get the same in Axes tab by specifying Static min and static max like below
Ex:
static min : '$'&10
Static Max: '$'&50
Static Step: '$'& 10
you can use your own expression by replacing the above values.
- Mark as New
- Bookmark
- Subscribe
- Mute
- Subscribe to RSS Feed
- Permalink
- Report Inappropriate Content
Have you used the Symbols in the lower rigth side of number formatting?
- Mark as New
- Bookmark
- Subscribe
- Mute
- Subscribe to RSS Feed
- Permalink
- Report Inappropriate Content
Hi,
As an alternative you can add text in chart under the presentation tab as 'Amount in $' or something to denote its in dollars.
Regards,
Pratik
- Mark as New
- Bookmark
- Subscribe
- Mute
- Subscribe to RSS Feed
- Permalink
- Report Inappropriate Content
Just to inform that this $ will not work if the height of chart is small. It is a Bug.
- Mark as New
- Bookmark
- Subscribe
- Mute
- Subscribe to RSS Feed
- Permalink
- Report Inappropriate Content
man define static min and max
Thanks