Unlock a world of possibilities! Login now and discover the exclusive benefits awaiting you.
- Qlik Community
- :
- All Forums
- :
- QlikView App Dev
- :
- Re: How to analysis using more and selected dimens...
Options
- Subscribe to RSS Feed
- Mark Topic as New
- Mark Topic as Read
- Float this Topic for Current User
- Bookmark
- Subscribe
- Mute
- Printer Friendly Page
Turn on suggestions
Auto-suggest helps you quickly narrow down your search results by suggesting possible matches as you type.
Showing results for
Not applicable
2014-10-29
02:48 AM
- Mark as New
- Bookmark
- Subscribe
- Mute
- Subscribe to RSS Feed
- Permalink
- Report Inappropriate Content
How to analysis using more and selected dimensions?
Hi All,
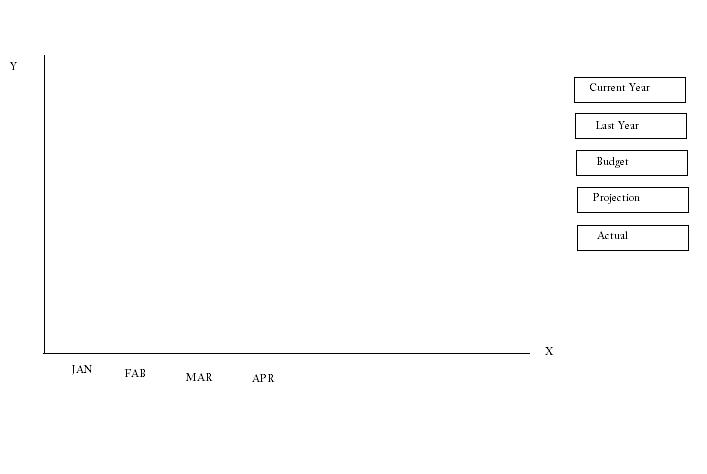
I want to make a table looks like below, where the X axes always in months. I need dimensions to appear or show on the chart according to my selection as I want to analysis I'll be selecting the dimensions.
Eg: If I want to analysis Budget + Projection I'll be selecting only those to and it should appear month wise
same as that I'll be selecting different, different dimension according to my need.
can I do this analysing in qlikview or is there any other ways to do thing like this?
Please help me on this... Thanks in advance..!!! Andrea GhirardelloJuan Gerardo Cabeza LuqueMarcus Sommer
- Tags:
- analysis
1,140 Views
- « Previous Replies
-
- 1
- 2
- Next Replies »
10 Replies
Not applicable
2014-10-29
10:00 PM
Author
- Mark as New
- Bookmark
- Subscribe
- Mute
- Subscribe to RSS Feed
- Permalink
- Report Inappropriate Content
Make séance thank you so much!
126 Views
- « Previous Replies
-
- 1
- 2
- Next Replies »