Unlock a world of possibilities! Login now and discover the exclusive benefits awaiting you.
- Qlik Community
- :
- All Forums
- :
- QlikView App Dev
- :
- Re: How to animate scatter chart?
- Subscribe to RSS Feed
- Mark Topic as New
- Mark Topic as Read
- Float this Topic for Current User
- Bookmark
- Subscribe
- Mute
- Printer Friendly Page
- Mark as New
- Bookmark
- Subscribe
- Mute
- Subscribe to RSS Feed
- Permalink
- Report Inappropriate Content
How to animate scatter chart?
I have a very simple scenario. I have KPIs and coordinates to plot them in a scatter chart. In a nutshell my problem is that when I animate the scatter chart I do not see the bubbles moving. Instead I see lines being drawn on the values.
Here is my sample data:
Load * inline
[
KPI,Month,X,Y
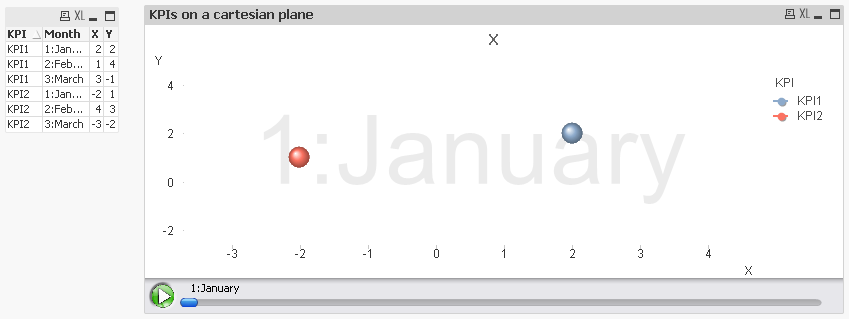
KPI1,1:January,2,2
KPI1,2:February,1,4
KPI1,3:March,3,-1
KPI2,1:January,-2,1
KPI2,2:February,4,3
KPI2,3:March,-3,-2
];
At first I see the correct bubbles
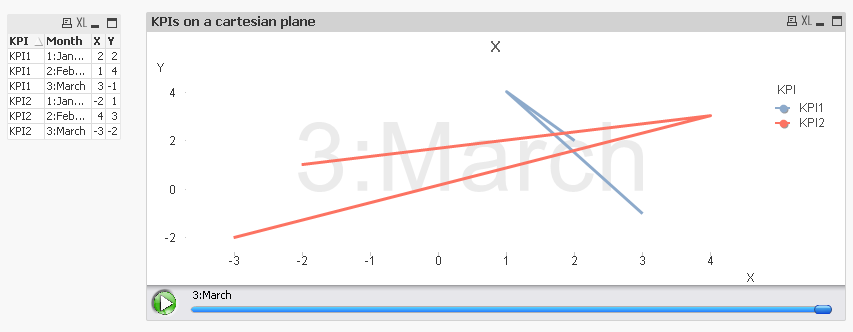
But when I animate here's what I see:
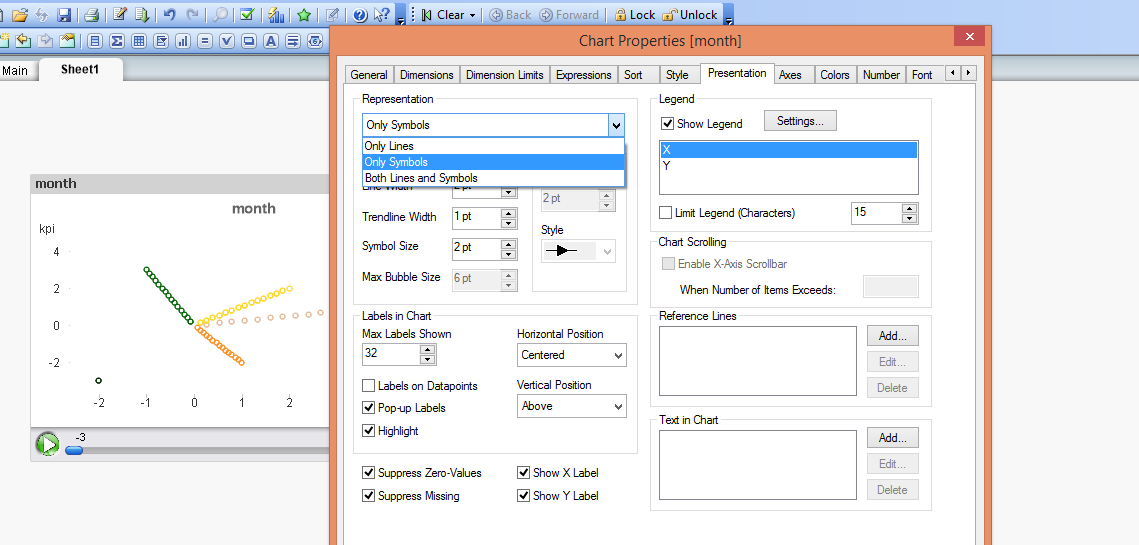
Here's how my chart is configured:


What am I doing wrong? How can I see the bubbles moving when I animate, instead of the lines?
Thanks!!!
Mara
Accepted Solutions
- Mark as New
- Bookmark
- Subscribe
- Mute
- Subscribe to RSS Feed
- Permalink
- Report Inappropriate Content
This was a bug that is corrected in QV 11.20 SR13.
- Mark as New
- Bookmark
- Subscribe
- Mute
- Subscribe to RSS Feed
- Permalink
- Report Inappropriate Content
hi,
- Mark as New
- Bookmark
- Subscribe
- Mute
- Subscribe to RSS Feed
- Permalink
- Report Inappropriate Content
see the bellow link, it might be helpful..
- Mark as New
- Bookmark
- Subscribe
- Mute
- Subscribe to RSS Feed
- Permalink
- Report Inappropriate Content
Hi
1. Add the dimension that shows change in time (eg: date) as first dimension. I.e. you need to add it and promote it so that it is the dimension in the top of the list.
2. Make sure that you have “Only Symbols” as representation.
3. Press the “Animate” button in the properties->dimensions.
4. Tick “Animate first dimension”. Press OK.
- Mark as New
- Bookmark
- Subscribe
- Mute
- Subscribe to RSS Feed
- Permalink
- Report Inappropriate Content
This was a bug that is corrected in QV 11.20 SR13.
- Mark as New
- Bookmark
- Subscribe
- Mute
- Subscribe to RSS Feed
- Permalink
- Report Inappropriate Content
ohhh thnx fr update.
- Mark as New
- Bookmark
- Subscribe
- Mute
- Subscribe to RSS Feed
- Permalink
- Report Inappropriate Content
Thank you Sureshqv. I would like the symbol to move and not get replicated. How can I do that?
Thanks!!!
- Mark as New
- Bookmark
- Subscribe
- Mute
- Subscribe to RSS Feed
- Permalink
- Report Inappropriate Content
That's it! Thank you! It was driving me nuts.
- Mark as New
- Bookmark
- Subscribe
- Mute
- Subscribe to RSS Feed
- Permalink
- Report Inappropriate Content
i thnk it is nt psbl...
- Mark as New
- Bookmark
- Subscribe
- Mute
- Subscribe to RSS Feed
- Permalink
- Report Inappropriate Content
As you can see above it is possible if you upgrade QV. 