Unlock a world of possibilities! Login now and discover the exclusive benefits awaiting you.
- Qlik Community
- :
- All Forums
- :
- QlikView App Dev
- :
- Re: How to build a week-on-week report?
- Subscribe to RSS Feed
- Mark Topic as New
- Mark Topic as Read
- Float this Topic for Current User
- Bookmark
- Subscribe
- Mute
- Printer Friendly Page
- Mark as New
- Bookmark
- Subscribe
- Mute
- Subscribe to RSS Feed
- Permalink
- Report Inappropriate Content
How to build a week-on-week report?
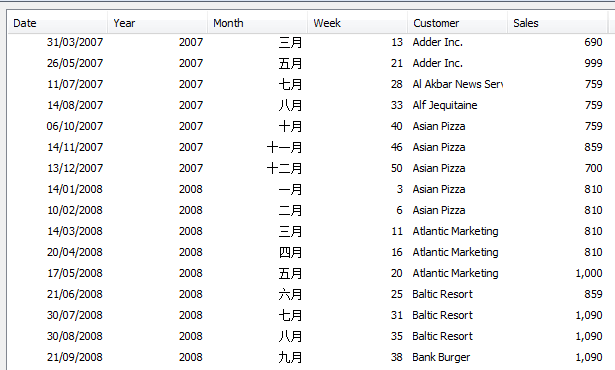
I have a sales data by date, I want to produce a report Week-on-Week, so I can have the sales compare by week.
How can I produce this report?
Thank you!
- Tags:
- new_to_qlikview
- Mark as New
- Bookmark
- Subscribe
- Mute
- Subscribe to RSS Feed
- Permalink
- Report Inappropriate Content
Just use Week (or Year and Week) as dimension in a chart and your Sales data in an aggregation function as expression:
=sum(Sales)
- Mark as New
- Bookmark
- Subscribe
- Mute
- Subscribe to RSS Feed
- Permalink
- Report Inappropriate Content
I want to ge the compare data like the sales amount of year-week 31 vs year-week 30, increase, increase %...
like this:
outlets,sales of week 31, sales of week 30
outlet A, $120110, $97107
outlet B, $78130, $97236
outlet C, $98670, $119452
I want to have a sheet or a chart to display the week-on-week comparison.
How can I get this?
Thank you!
- Mark as New
- Bookmark
- Subscribe
- Mute
- Subscribe to RSS Feed
- Permalink
- Report Inappropriate Content
Hi i think u can create a listbox with weeknumber on the followwing date filed
week (DATE) AS WeekNumber
This can be done in 2 ways.
1) using Alternate states
2) create 2 variables one with curent week and other with previousweek
vcurrentrweek = weeknumber
vpreviousnumver =weeknumber-1
then use the variabels in the set analysis create 2 expressions with outleet as dimension..
for current week sum({<Week = {'$(vcurrentweek)'}>}sales)
for previous week sum({<Week = {'$(vpreviousweek)'}>}sales)
- Mark as New
- Bookmark
- Subscribe
- Mute
- Subscribe to RSS Feed
- Permalink
- Report Inappropriate Content
its easy to implement alternate state... less script