Unlock a world of possibilities! Login now and discover the exclusive benefits awaiting you.
- Qlik Community
- :
- All Forums
- :
- QlikView App Dev
- :
- Re: How to calculate MAT with two dimensions
- Subscribe to RSS Feed
- Mark Topic as New
- Mark Topic as Read
- Float this Topic for Current User
- Bookmark
- Subscribe
- Mute
- Printer Friendly Page
- Mark as New
- Bookmark
- Subscribe
- Mute
- Subscribe to RSS Feed
- Permalink
- Report Inappropriate Content
How to calculate MAT with two dimensions
Hi Guys,
I need to calculate MAT for the available data
Moving Average Turnover (MAT):
Dimensions:
1. Year
2. Brand
Expression : (Current Year - Previous Year) / Previous Year
Current Year : latest 12 months i.e.,(Aug-15 to Jul-16)
Previous Year : previous latest 12 months i.e.,(Aug-14 to Jul-15)
Expression output value should be plotted in latest year i.e., 2016
Need to show all the Year
Example 1:
Dimension Expression
2016 (Current Year (Aug-15 to Jul-16) - Previous Year (Aug-14 to Jul-15)) / Previous Year (Aug-14 to Jul-15))
2015 (Current Year (Aug-14 to Jul-15) - Previous Year (Aug-13 to Jul-14)) / Previous Year (Aug-13 to Jul-14))
sooo on for the remaining years
Month interval has to vary based on the selection
Exanple 2:
Selection: Year= 2016 Month= Apr
Dimension Expression
2016 (Current Year (May-15 to Apr-16) - Previous Year (May-14 to Apr-15)) / Previous Year (May-14 to Apr-15))
2015 (Current Year (May-14 to Apr-15) - Previous Year (May-13 to Apr-14)) / Previous Year (May-13 to Apr-14))
sooo on for the remaining years
Selection: Year= 2015
Dimension Expression
2015 (Current Year (Jan-15 to Dec-15) - Previous Year (Jan-14 to Dec-14)) / Previous Year (Jan-14 to Dec-14))
2014 (Current Year (Jan-14 to Dec-14) - Previous Year (Jan-13 to Dec-13)) / Previous Year (Jan-13 to Dec-13))
sooo on for the remaining years
Attached the same data
- « Previous Replies
- Next Replies »
Accepted Solutions
- Mark as New
- Bookmark
- Subscribe
- Mute
- Subscribe to RSS Feed
- Permalink
- Report Inappropriate Content
- Mark as New
- Bookmark
- Subscribe
- Mute
- Subscribe to RSS Feed
- Permalink
- Report Inappropriate Content
Hey -
Can you share you result in terms of numbers. I see you have AsOfPeriod in your Aggr() dimension, but used Year as dimension. Have you created AsOfYear also?
- Mark as New
- Bookmark
- Subscribe
- Mute
- Subscribe to RSS Feed
- Permalink
- Report Inappropriate Content
yeah sure sunny just give me few minutes
- Mark as New
- Bookmark
- Subscribe
- Mute
- Subscribe to RSS Feed
- Permalink
- Report Inappropriate Content
I see that Year is what I wanted AsOfYear to be.... So I think we are good there. All we need to know is the output you are looking for in terms of numbers
- Mark as New
- Bookmark
- Subscribe
- Mute
- Subscribe to RSS Feed
- Permalink
- Report Inappropriate Content
In the Qvw
i consider Year AsOf Year
but the values iam looking is
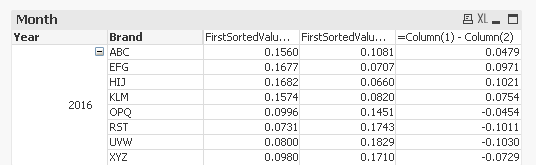
in the qvw there is month pivot table
that month table display latest 12 months sales against brands
now i need to show sum of these 12 months sales in max year against brands
- Mark as New
- Bookmark
- Subscribe
- Mute
- Subscribe to RSS Feed
- Permalink
- Report Inappropriate Content
Yeah Sunny Exactly
Output values in numbers or may be decimals
- Mark as New
- Bookmark
- Subscribe
- Mute
- Subscribe to RSS Feed
- Permalink
- Report Inappropriate Content
Leaving for work, will check it out once I reach office.
- Mark as New
- Bookmark
- Subscribe
- Mute
- Subscribe to RSS Feed
- Permalink
- Report Inappropriate Content
Actually we solve these kind of queries with one dimension
below is the thread
- Mark as New
- Bookmark
- Subscribe
- Mute
- Subscribe to RSS Feed
- Permalink
- Report Inappropriate Content
Ok Sunny.. iam will wait for your reply
have a great day....
- Mark as New
- Bookmark
- Subscribe
- Mute
- Subscribe to RSS Feed
- Permalink
- Report Inappropriate Content
May be this
Aggr(FirstSortedValue({<MonthNr = {$(=Max({<Year = {$(=Max(Year))}>}MonthNr))}, Year = {"$(='<=' & Max(Year))"}, Month>}
Aggr(rangesum(above(sum({<Year,Brand,Month>}Sales),0,12)), Brand, AsOfPeriod),
-Aggr(Only({<Year, Brand, Month>}AsOfPeriod), Brand, AsOfPeriod))
/
Above(FirstSortedValue({<MonthNr = {$(=Max({<Year = {$(=Max(Year))}>}MonthNr))}, Year = {"$(='<=' & Max(Year))"}, Month>}
Aggr(rangesum(above(sum({<Year,Brand,Month>}Sales),0,12)), Brand, AsOfPeriod),
-Aggr(Only({<Year, Brand, Month>}AsOfPeriod), Brand, AsOfPeriod)))-1, Brand, Year)
- « Previous Replies
- Next Replies »