Unlock a world of possibilities! Login now and discover the exclusive benefits awaiting you.
- Qlik Community
- :
- All Forums
- :
- QlikView App Dev
- :
- Re: How to calculate MAT with two dimensions
- Subscribe to RSS Feed
- Mark Topic as New
- Mark Topic as Read
- Float this Topic for Current User
- Bookmark
- Subscribe
- Mute
- Printer Friendly Page
- Mark as New
- Bookmark
- Subscribe
- Mute
- Subscribe to RSS Feed
- Permalink
- Report Inappropriate Content
How to calculate MAT with two dimensions
Hi Guys,
I need to calculate MAT for the available data
Moving Average Turnover (MAT):
Dimensions:
1. Year
2. Brand
Expression : (Current Year - Previous Year) / Previous Year
Current Year : latest 12 months i.e.,(Aug-15 to Jul-16)
Previous Year : previous latest 12 months i.e.,(Aug-14 to Jul-15)
Expression output value should be plotted in latest year i.e., 2016
Need to show all the Year
Example 1:
Dimension Expression
2016 (Current Year (Aug-15 to Jul-16) - Previous Year (Aug-14 to Jul-15)) / Previous Year (Aug-14 to Jul-15))
2015 (Current Year (Aug-14 to Jul-15) - Previous Year (Aug-13 to Jul-14)) / Previous Year (Aug-13 to Jul-14))
sooo on for the remaining years
Month interval has to vary based on the selection
Exanple 2:
Selection: Year= 2016 Month= Apr
Dimension Expression
2016 (Current Year (May-15 to Apr-16) - Previous Year (May-14 to Apr-15)) / Previous Year (May-14 to Apr-15))
2015 (Current Year (May-14 to Apr-15) - Previous Year (May-13 to Apr-14)) / Previous Year (May-13 to Apr-14))
sooo on for the remaining years
Selection: Year= 2015
Dimension Expression
2015 (Current Year (Jan-15 to Dec-15) - Previous Year (Jan-14 to Dec-14)) / Previous Year (Jan-14 to Dec-14))
2014 (Current Year (Jan-14 to Dec-14) - Previous Year (Jan-13 to Dec-13)) / Previous Year (Jan-13 to Dec-13))
sooo on for the remaining years
Attached the same data
- Mark as New
- Bookmark
- Subscribe
- Mute
- Subscribe to RSS Feed
- Permalink
- Report Inappropriate Content
Hi Sunny..
Apologies for the delay as like before i was a bit confused in the requirement there is a change in the calculation
Formula:
(Current Year MAT Sale / Current Year MAT Total Sale)
-
(Previous Year MAT Sale / Previous Year MAT Total Sale)
Current Year : latest 12 months i.e.,(Aug-15 to Jul-16)
Previous Year : previous latest 12 months i.e.,(Aug-14 to Jul-15)
Expression output value should be plotted in latest year i.e., 2016
- Mark as New
- Bookmark
- Subscribe
- Mute
- Subscribe to RSS Feed
- Permalink
- Report Inappropriate Content
Would you be able to do this calculation manually for one of the brands and tell me what is the number that you expect to see? That will be huge help
- Mark as New
- Bookmark
- Subscribe
- Mute
- Subscribe to RSS Feed
- Permalink
- Report Inappropriate Content
Sure sunny... Iam dng the same 
- Mark as New
- Bookmark
- Subscribe
- Mute
- Subscribe to RSS Feed
- Permalink
- Report Inappropriate Content
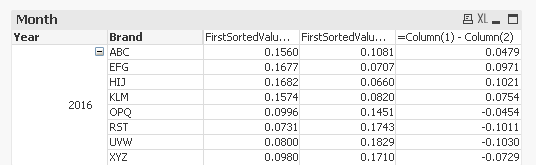
i check for Brand = ABC
Current Year MAT Sale = 6111
Current Year MAT Total Sale = 39174
Previous Year MAT Sale = 3831
Previous Year MAT Total Sale = 35427
As per formula output result = 0.0478584631
- Mark as New
- Bookmark
- Subscribe
- Mute
- Subscribe to RSS Feed
- Permalink
- Report Inappropriate Content
Any clue r suggestion stalwar1
i think we have to use period type as also.....
- Mark as New
- Bookmark
- Subscribe
- Mute
- Subscribe to RSS Feed
- Permalink
- Report Inappropriate Content
Try this
- Mark as New
- Bookmark
- Subscribe
- Mute
- Subscribe to RSS Feed
- Permalink
- Report Inappropriate Content
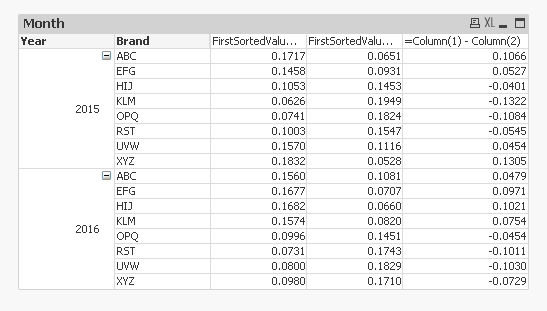
output of the result is correct , But one more request i need to show all the years kindly resolve it ...
- Mark as New
- Bookmark
- Subscribe
- Mute
- Subscribe to RSS Feed
- Permalink
- Report Inappropriate Content
Like this
- Mark as New
- Bookmark
- Subscribe
- Mute
- Subscribe to RSS Feed
- Permalink
- Report Inappropriate Content
like that only, i tired with <= in the year .
it is showing only two years but in the year field we have from 2010 to 2016
when i select the year=2014 no data to display pls check it once...
- Mark as New
- Bookmark
- Subscribe
- Mute
- Subscribe to RSS Feed
- Permalink
- Report Inappropriate Content
Your AsOfPeriod chart above that also shows 2015 data. I am not sure if you have data in your application bro. Was this a sample which included only partial data?