Unlock a world of possibilities! Login now and discover the exclusive benefits awaiting you.
- Qlik Community
- :
- All Forums
- :
- QlikView App Dev
- :
- Re: How to calculate month-on-month comparison?
- Subscribe to RSS Feed
- Mark Topic as New
- Mark Topic as Read
- Float this Topic for Current User
- Bookmark
- Subscribe
- Mute
- Printer Friendly Page
- Mark as New
- Bookmark
- Subscribe
- Mute
- Subscribe to RSS Feed
- Permalink
- Report Inappropriate Content
How to calculate month-on-month comparison?
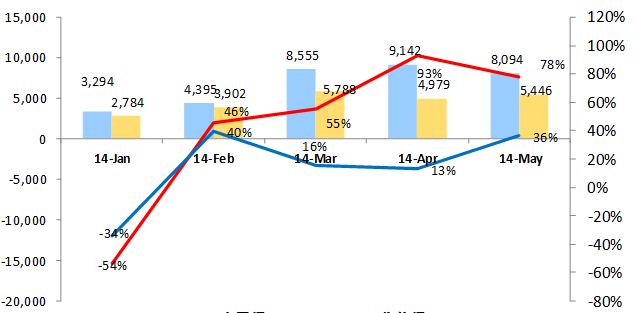
As we can see from the picture above,there are two columns and two lines in the chart.
I have already add two columns and the expressions are used as follows:
ADamount: sum({$<cal_month={"2014*"}>}[AD_amount])/1000
Receiveamount: sum({$<cal_month={"2014*"}>}[receiveamount])/1000
But how to add two lines as month-on-month comparison?
- « Previous Replies
-
- 1
- 2
- Next Replies »
Accepted Solutions
- Mark as New
- Bookmark
- Subscribe
- Mute
- Subscribe to RSS Feed
- Permalink
- Report Inappropriate Content
Can't you try using above.
Sum(AD_amount)- Sum(above(AD_amount)) as the MOM Expression?
- Mark as New
- Bookmark
- Subscribe
- Mute
- Subscribe to RSS Feed
- Permalink
- Report Inappropriate Content
Use combo chart. Four expressions. In the expression tab, you can select an expression and choose bar/line from display options.
- Mark as New
- Bookmark
- Subscribe
- Mute
- Subscribe to RSS Feed
- Permalink
- Report Inappropriate Content
I know it need combo chart. But how to write the expressions?
- Mark as New
- Bookmark
- Subscribe
- Mute
- Subscribe to RSS Feed
- Permalink
- Report Inappropriate Content
Can anyone solve the problem?
- Mark as New
- Bookmark
- Subscribe
- Mute
- Subscribe to RSS Feed
- Permalink
- Report Inappropriate Content
Can't you try using above.
Sum(AD_amount)- Sum(above(AD_amount)) as the MOM Expression?
- Mark as New
- Bookmark
- Subscribe
- Mute
- Subscribe to RSS Feed
- Permalink
- Report Inappropriate Content
Thank you for your reply.
But when I use your expression,it doesn't show any number,why?
- Mark as New
- Bookmark
- Subscribe
- Mute
- Subscribe to RSS Feed
- Permalink
- Report Inappropriate Content
Oh, I've modified the expression to:
sum({$<cal_month={"2014*"}>}[AD_amount])/1000/Above(sum({$<cal_month={"2014*"}>}[AD_amount])/1000)-1
And it works.
Thank you very much.
- Mark as New
- Bookmark
- Subscribe
- Mute
- Subscribe to RSS Feed
- Permalink
- Report Inappropriate Content
can you mark the thread as 'Answered' please?
- Mark as New
- Bookmark
- Subscribe
- Mute
- Subscribe to RSS Feed
- Permalink
- Report Inappropriate Content
Done. Thank you very much.
- Mark as New
- Bookmark
- Subscribe
- Mute
- Subscribe to RSS Feed
- Permalink
- Report Inappropriate Content
hi Joy, would you mind share this chart.
- « Previous Replies
-
- 1
- 2
- Next Replies »