Unlock a world of possibilities! Login now and discover the exclusive benefits awaiting you.
- Qlik Community
- :
- All Forums
- :
- QlikView App Dev
- :
- Re: How to calculate overdue from specific date an...
- Subscribe to RSS Feed
- Mark Topic as New
- Mark Topic as Read
- Float this Topic for Current User
- Bookmark
- Subscribe
- Mute
- Printer Friendly Page
- Mark as New
- Bookmark
- Subscribe
- Mute
- Subscribe to RSS Feed
- Permalink
- Report Inappropriate Content
How to calculate overdue from specific date and show in pie and table chart
I want to calculate overdue from specific date. I want to show this result in Table Chart and pie chart
i have mentioned different overdue in attached excel.
I have no idea how to proceed the overdue calculations.
pls. find attached excel and let me know if you have any doubts.
pls. help this is urgent and i am waiting for long time.
Note : KEY column is "Received Date" for process the formula
- « Previous Replies
-
- 1
- 2
- Next Replies »
Accepted Solutions
- Mark as New
- Bookmark
- Subscribe
- Mute
- Subscribe to RSS Feed
- Permalink
- Report Inappropriate Content
Please find attached QVW, i think it will be fine now.
let know in case of any issue concern.
Regards,
Parthesh.
- Mark as New
- Bookmark
- Subscribe
- Mute
- Subscribe to RSS Feed
- Permalink
- Report Inappropriate Content
=count(DISTINCT if((Date(NewDate,'dd-mm-yyyy')+GetFieldSelections(SeqDays) - Today() > -5 and Date(NewDate,'dd-mm-yyyy')+GetFieldSelections(SeqDays) - Today() < 0) and (EMP_SECTION like '*B-*' or EMP_SECTION like '*C-*'),NewDate))
- Mark as New
- Bookmark
- Subscribe
- Mute
- Subscribe to RSS Feed
- Permalink
- Report Inappropriate Content
Hello,
Please check attached QVW, i have modified QVW which you have attached in post.
hope it will help, Let me if you are not looking for this.
Regards,
Parthesh.
- Mark as New
- Bookmark
- Subscribe
- Mute
- Subscribe to RSS Feed
- Permalink
- Report Inappropriate Content
Its awesome and this my requirements
I have modified few points in QVW file. find attached.
I have few doubts below.
1. Instead of 5 difference, i have added list box. so that end user can select dynamic value. pls. check the count and confirm.
2. In table box, i just want to hide 3 columns (donot delete). i want to display only <5, 100 to 20 days and >20 Days column is enough.
3. Instead of column (1) and column(2), can we specify the field name.?
4. In the table box, on top of that we need total count for all the 3 conditions (<5 days, 10 to 20 days, > 20 days) instead of zero.
5. both table chart count and pie chart count should match always for all 3 conditions (<5 days, 10 to 20 days, > 20 days).
If the above is through, then we achieved.
pls. let me know if you need any more doubts.
- Mark as New
- Bookmark
- Subscribe
- Mute
- Subscribe to RSS Feed
- Permalink
- Report Inappropriate Content
- Mark as New
- Bookmark
- Subscribe
- Mute
- Subscribe to RSS Feed
- Permalink
- Report Inappropriate Content
1. both table chart count and pie chart count should match always for all 3 conditions (<5 days, 10 to 20 days, > 20 days).
2. Instead of using 5 is the difference, i have added list box. so that end user can select dynamic value. pls. check the count and confirm.
3. In table box, i just want to hide 3 columns (donot delete). i want to display only <5, 100 to 20 days and >20 Days column is enough.
4. Instead of column (1) and column(2), can we specify the field name.?
5. In the table box, on top of that we need total count for all the 3 conditions (<5 days, 10 to 20 days, > 20 days) instead of zero.
pls. respond immediately.
atleast point no. 1, 2 and 4 is most important. i tried, but, i am not able to get the exact values.
For < days,
both Pie and Table values showing different number..???????
pls. find updated file as attached.
- Mark as New
- Bookmark
- Subscribe
- Mute
- Subscribe to RSS Feed
- Permalink
- Report Inappropriate Content
Can you pls. check my comments..?
I am waiting and this is urgent..
- Mark as New
- Bookmark
- Subscribe
- Mute
- Subscribe to RSS Feed
- Permalink
- Report Inappropriate Content
- Mark as New
- Bookmark
- Subscribe
- Mute
- Subscribe to RSS Feed
- Permalink
- Report Inappropriate Content
Thanks.
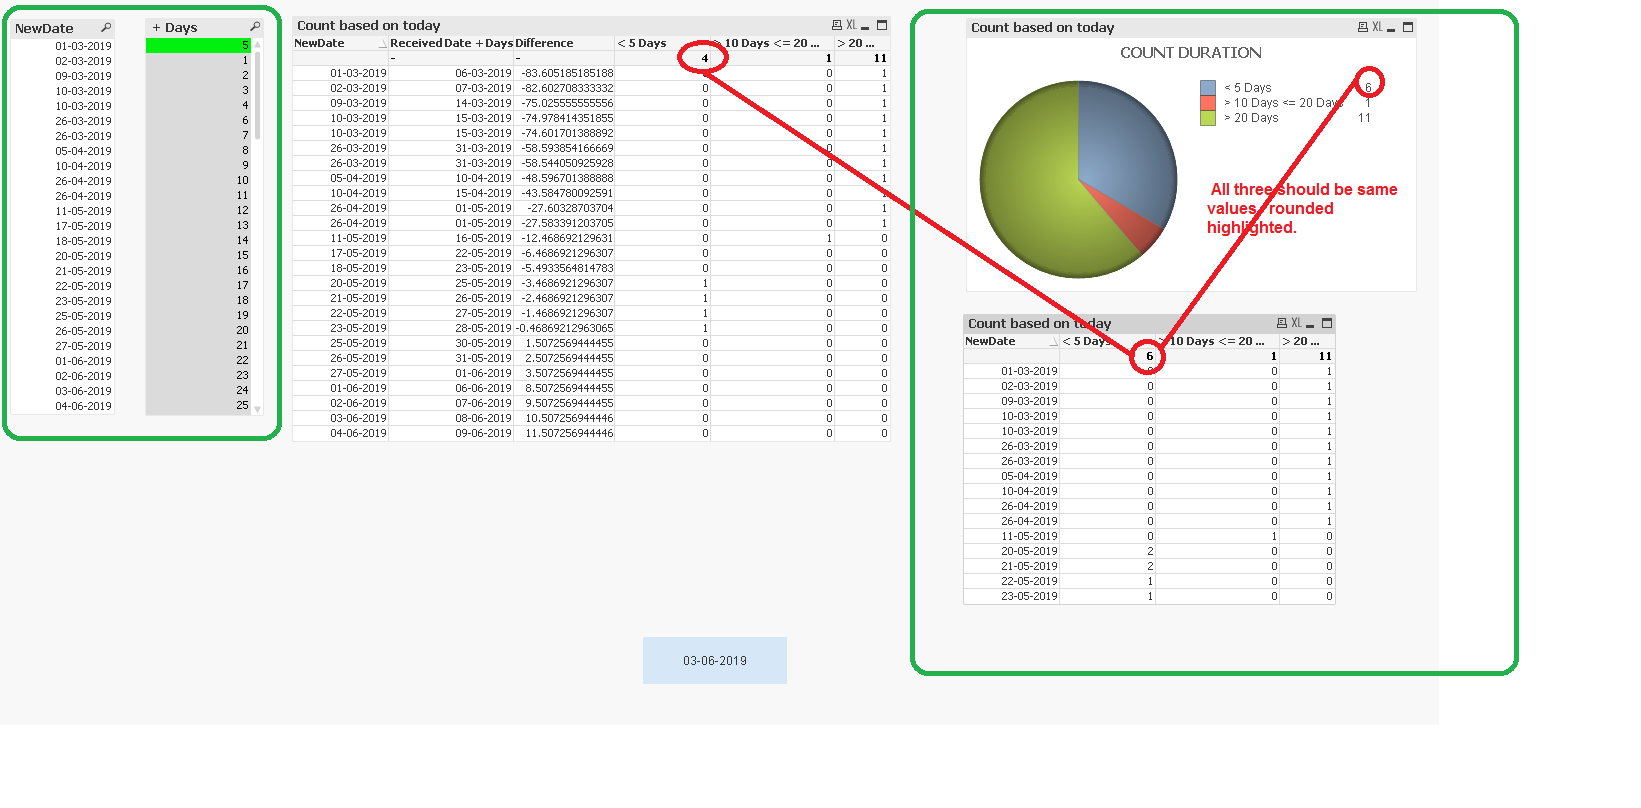
I am waiting. I have enclosed one more screenshot for your reference.
All the counts should be match both table and pie chart. (all 3 conditions (< days, 10 to 20 days and >20 days).
Thanks for your excellent support.
- Mark as New
- Bookmark
- Subscribe
- Mute
- Subscribe to RSS Feed
- Permalink
- Report Inappropriate Content
Please find attached QVW, i think it will be fine now.
let know in case of any issue concern.
Regards,
Parthesh.
- Mark as New
- Bookmark
- Subscribe
- Mute
- Subscribe to RSS Feed
- Permalink
- Report Inappropriate Content
i have one small doubt.
instead of using the lengthy formula, can we use variable and assign those variable in to formula...?
for example,
=count(DISTINCT if(Date(NewDate,'dd-mm-yyyy')+GetFieldSelections(SeqDays) - Today() > -5 and Date(NewDate,'dd-mm-yyyy')+GetFieldSelections(SeqDays) - Today() < 0,NewDate))
var 1 = Date(NewDate,'dd-mm-yyyy')+GetFieldSelections(SeqDays) - Today()
var 2 = Date(NewDate,'dd-mm-yyyy')+GetFieldSelections(SeqDays) - Today()
Will it work...?
reply when you are free....
Thanks again.!!!!!
- « Previous Replies
-
- 1
- 2
- Next Replies »