Unlock a world of possibilities! Login now and discover the exclusive benefits awaiting you.
- Qlik Community
- :
- All Forums
- :
- QlikView App Dev
- :
- How to calculate time spent by user on each Dashbo...
- Subscribe to RSS Feed
- Mark Topic as New
- Mark Topic as Read
- Float this Topic for Current User
- Bookmark
- Subscribe
- Mute
- Printer Friendly Page
- Mark as New
- Bookmark
- Subscribe
- Mute
- Subscribe to RSS Feed
- Permalink
- Report Inappropriate Content
How to calculate time spent by user on each Dashboard & Sheet
Hi,
I am trying to calculate, how much time a user has spent on each dashboard and sheet.
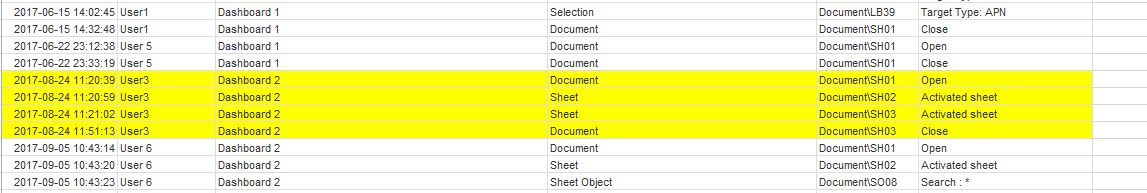
Example: In the below image, i want to calculate time spent (in minutes) by user 3 on dashboard 2 and also time spent in minutes on SH01, SH02 and SH03.
The above example is just for one user. However I want to calculate for all the users. Please help me.
Please find the data attached. youssefbelloum
- Mark as New
- Bookmark
- Subscribe
- Mute
- Subscribe to RSS Feed
- Permalink
- Report Inappropriate Content
Hi Shivesh,
Waiting for your response. Please let me know if you need more information.
- Mark as New
- Bookmark
- Subscribe
- Mute
- Subscribe to RSS Feed
- Permalink
- Report Inappropriate Content
Hi stalwar1, based on what i have done above, I can't display all timestamp lines when i remove all the dimensions coming before ObjectID..
I tried a lot of things but I don't know why it doesn't work..
what I'm trying to do is having only the red parts on this table, with the 4 lines displayed
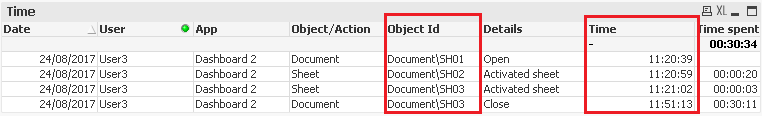
can you help please ?
- Mark as New
- Bookmark
- Subscribe
- Mute
- Subscribe to RSS Feed
- Permalink
- Report Inappropriate Content
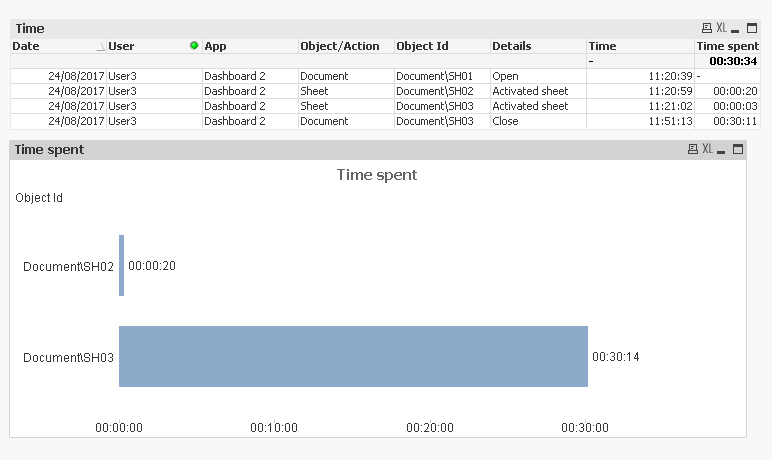
I am not sure what the expected output is for the bar chart? Something like this
- Mark as New
- Bookmark
- Subscribe
- Mute
- Subscribe to RSS Feed
- Permalink
- Report Inappropriate Content
Two of the objects ID are the same.... how do you expect to see 4? Shouldn't it be 3?
- Mark as New
- Bookmark
- Subscribe
- Mute
- Subscribe to RSS Feed
- Permalink
- Report Inappropriate Content
there is no option to see total lines with this dimension ?
because there is 4 different Timestamp
- Mark as New
- Bookmark
- Subscribe
- Mute
- Subscribe to RSS Feed
- Permalink
- Report Inappropriate Content
Hi Sunny,
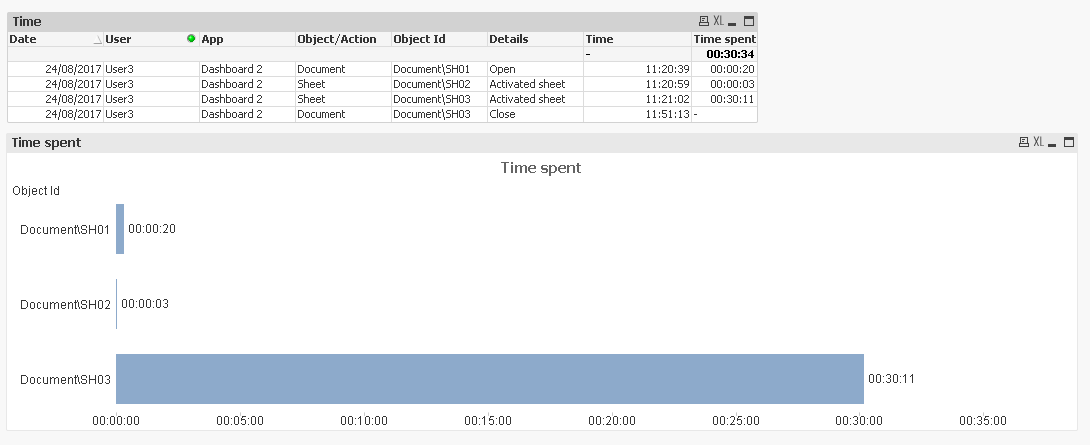
Thanks for your reply. Yes it should be three SH01,SH02 & SH03. And we want to show the results in mins.
- Mark as New
- Bookmark
- Subscribe
- Mute
- Subscribe to RSS Feed
- Permalink
- Report Inappropriate Content
May be this?
- Mark as New
- Bookmark
- Subscribe
- Mute
- Subscribe to RSS Feed
- Permalink
- Report Inappropriate Content
can't we get it work with above ?
- Mark as New
- Bookmark
- Subscribe
- Mute
- Subscribe to RSS Feed
- Permalink
- Report Inappropriate Content
You mean using Above() function rather than Below() function?
- Mark as New
- Bookmark
- Subscribe
- Mute
- Subscribe to RSS Feed
- Permalink
- Report Inappropriate Content
Yes