Unlock a world of possibilities! Login now and discover the exclusive benefits awaiting you.
- Qlik Community
- :
- All Forums
- :
- QlikView App Dev
- :
- Re: How to change 'Text on Axis' size
Options
- Subscribe to RSS Feed
- Mark Topic as New
- Mark Topic as Read
- Float this Topic for Current User
- Bookmark
- Subscribe
- Mute
- Printer Friendly Page
Turn on suggestions
Auto-suggest helps you quickly narrow down your search results by suggesting possible matches as you type.
Showing results for
Not applicable
2013-06-05
06:01 AM
- Mark as New
- Bookmark
- Subscribe
- Mute
- Subscribe to RSS Feed
- Permalink
- Report Inappropriate Content
How to change 'Text on Axis' size
Hi,
when using a bar chart, Expressions-->Display Options-->Text on Axis.
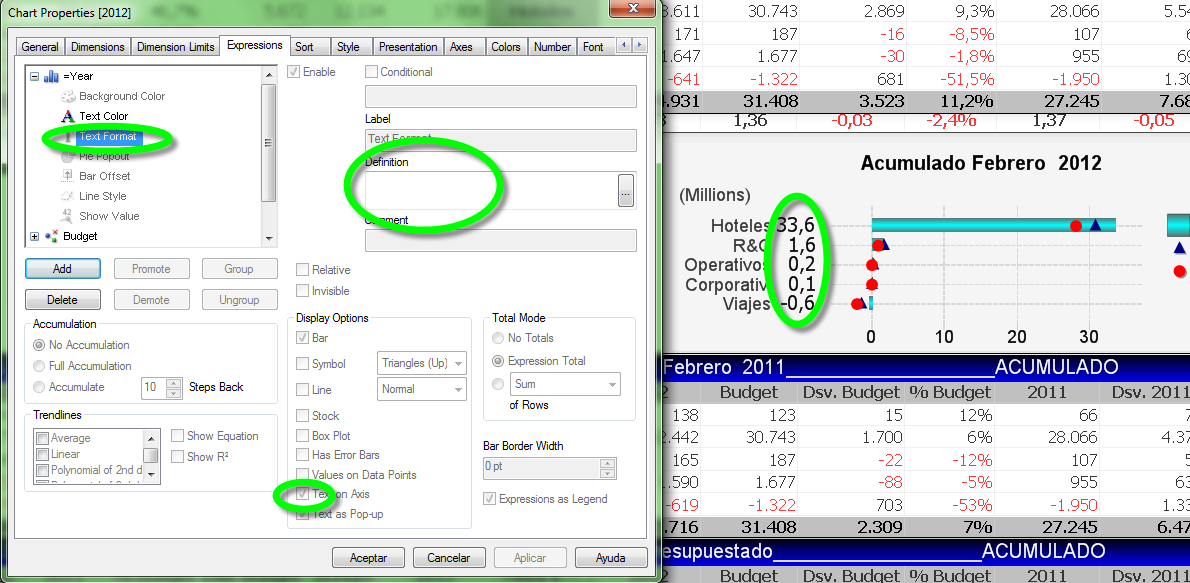
How to change the font size of the data showed?
Is there a funtion similar to RGB() to do this as a 'Definition' into the 'Text Format' expression?
Thanks
- « Previous Replies
-
- 1
- 2
- Next Replies »
11 Replies
Master II
2013-06-05
06:21 AM
- Mark as New
- Bookmark
- Subscribe
- Mute
- Subscribe to RSS Feed
- Permalink
- Report Inappropriate Content
go to
Expression>text format> ='<h6>'
HTH
Sushil
Creator II
2015-02-11
03:30 AM
- Mark as New
- Bookmark
- Subscribe
- Mute
- Subscribe to RSS Feed
- Permalink
- Report Inappropriate Content
Thats it. The 'quotes' were missing.
282 Views
- « Previous Replies
-
- 1
- 2
- Next Replies »