Unlock a world of possibilities! Login now and discover the exclusive benefits awaiting you.
- Qlik Community
- :
- All Forums
- :
- QlikView
- :
- How to change color in Pivot table?
- Subscribe to RSS Feed
- Mark Topic as New
- Mark Topic as Read
- Float this Topic for Current User
- Bookmark
- Subscribe
- Mute
- Printer Friendly Page
- Mark as New
- Bookmark
- Subscribe
- Mute
- Subscribe to RSS Feed
- Permalink
- Report Inappropriate Content
How to change color in Pivot table?
Hi All,
In pivot table, we are using 3 dimensions and 1 expression custom_value. Like below
But in pivot table it showing so many colmns. These column are loaded through inline.
Now I want to change cell color based on some condition. but there is only one expression and it showing many columns so please guide me where I need to write expression.
Thanks....
- « Previous Replies
-
- 1
- 2
- Next Replies »
- Mark as New
- Bookmark
- Subscribe
- Mute
- Subscribe to RSS Feed
- Permalink
- Report Inappropriate Content
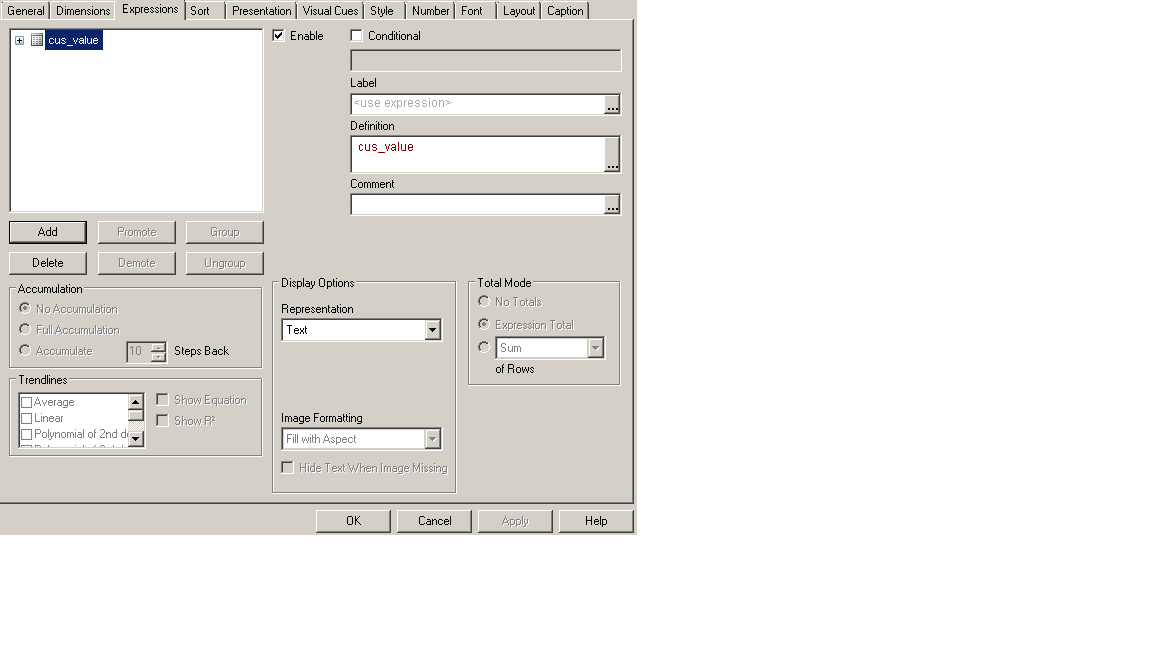
Click on the + in front of the expression. Then select Background Color. Next enter an expression in the Definition field to calculate the color based on your condition. For example =if(cus_value > 0, green(), red())
talk is cheap, supply exceeds demand
- Mark as New
- Bookmark
- Subscribe
- Mute
- Subscribe to RSS Feed
- Permalink
- Report Inappropriate Content
This I know.....but the problem is we are using only one custom_expression and it showing number of columns. So I have no idea where to write expression.
- Mark as New
- Bookmark
- Subscribe
- Mute
- Subscribe to RSS Feed
- Permalink
- Report Inappropriate Content
If you want to give the cell values in the expression column(s) a color then use the expression background color option. If you want the values in the dimension columns to have different colors then click on the + in front of the dimension, select background color and click on the Edit button to enter the expression to calculate the color. You will have to do that for each dimension where you want to use conditional colors.
talk is cheap, supply exceeds demand
- Mark as New
- Bookmark
- Subscribe
- Mute
- Subscribe to RSS Feed
- Permalink
- Report Inappropriate Content
Thanks for reply Gysbert....
Plz look my previous attachment there we are having one one expression but in Pivot table it showing more the 5 expressions like below:
So thats why I am clue less where I need to write. plz help me its very urgent..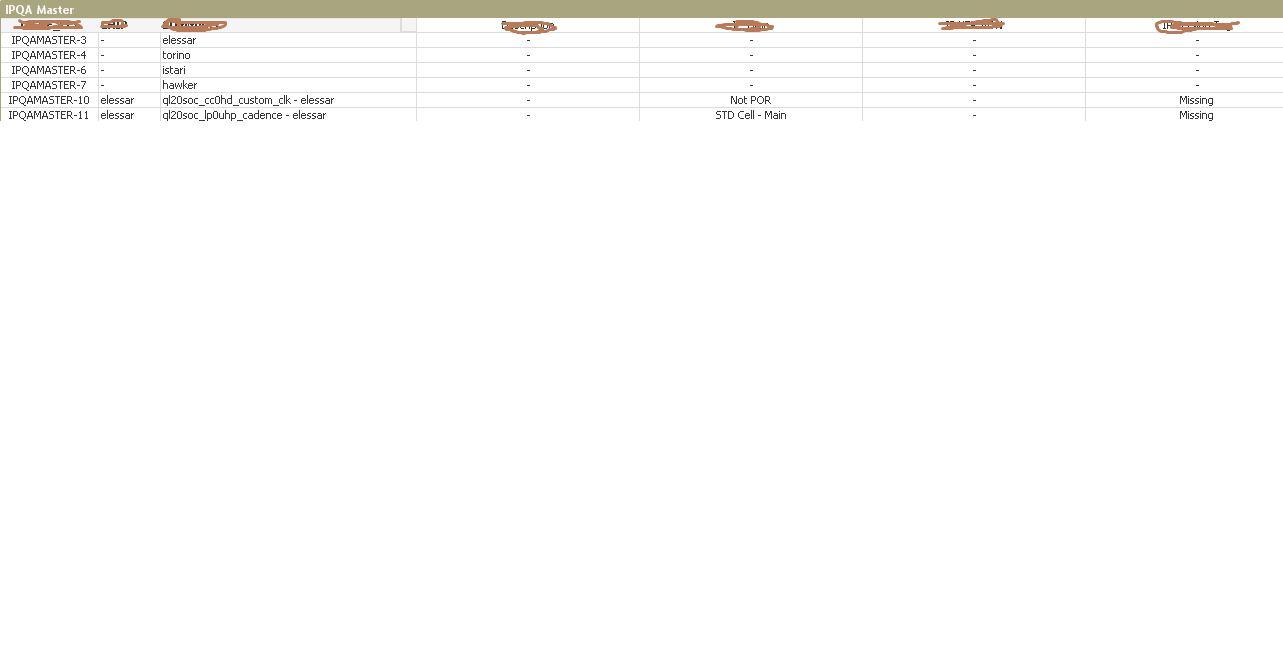
- Mark as New
- Bookmark
- Subscribe
- Mute
- Subscribe to RSS Feed
- Permalink
- Report Inappropriate Content
It looks like you have four dimensions, not three and that you pivoted one dimension to horizontal layout. The result of that is that you get a column for each value of that horizontal dimension. You still have only one expression, not five. Perhaps you should simply try defining a background color expression for your chart expression and see what happens. Just try it and look at what happens. It's not as if you can break anything.
talk is cheap, supply exceeds demand
- Mark as New
- Bookmark
- Subscribe
- Mute
- Subscribe to RSS Feed
- Permalink
- Report Inappropriate Content
Yes you are correct...we pivoted one dimensin to horizontal layout. How I will write plz give any idea.
I want
if (SW.Tag = PW.Tag)
then Pw.Tag: cell turns green
I wrote like under background color
if(SW.Tag=PW.Tag, Green())
But it showing error because SW.Tag and PW.Tag are directly not availabe bcz we pivoted it.
Please help...
- Mark as New
- Bookmark
- Subscribe
- Mute
- Subscribe to RSS Feed
- Permalink
- Report Inappropriate Content
you need to write and condition like below
if(pivoteddimension='abc' and expression>3,green(),
if(pivoteddimension='uhu' and expression>4, red ,blue())
- Mark as New
- Bookmark
- Subscribe
- Mute
- Subscribe to RSS Feed
- Permalink
- Report Inappropriate Content
Please any one help...its very urgent....
- Mark as New
- Bookmark
- Subscribe
- Mute
- Subscribe to RSS Feed
- Permalink
- Report Inappropriate Content
Hi Soha,
Please find the attached QVW.
See the Background color attribute of Country dimension in the Dimension tab of chart.
Also see the Design grid's use by activating it.
You can change the expression's color from the Visual Cues Tab.
- « Previous Replies
-
- 1
- 2
- Next Replies »