Unlock a world of possibilities! Login now and discover the exclusive benefits awaiting you.
- Qlik Community
- :
- All Forums
- :
- QlikView App Dev
- :
- How to change colour from low to high and high to ...
- Subscribe to RSS Feed
- Mark Topic as New
- Mark Topic as Read
- Float this Topic for Current User
- Bookmark
- Subscribe
- Mute
- Printer Friendly Page
- Mark as New
- Bookmark
- Subscribe
- Mute
- Subscribe to RSS Feed
- Permalink
- Report Inappropriate Content
How to change colour from low to high and high to low?
Hi
I have created Qlikview Extention world map.
I have loaded Growth(%) data into World Map.If i select colour as Green it is showing for all countries green.
But i need to represents colour like if(WW Growth is >3.6 then green colour else Red.
Here Growth value which is higher than 3.6 should show colour like High Green to low green (According to % value changing).If the growth is less than 3.6 then Red colour with low to High (according to % values compared).
Could you please help on above expression?
Thanks,
Raj
- Mark as New
- Bookmark
- Subscribe
- Mute
- Subscribe to RSS Feed
- Permalink
- Report Inappropriate Content
Hi,
Share some sample data so that it would be easier to provide the solution.
Try like this
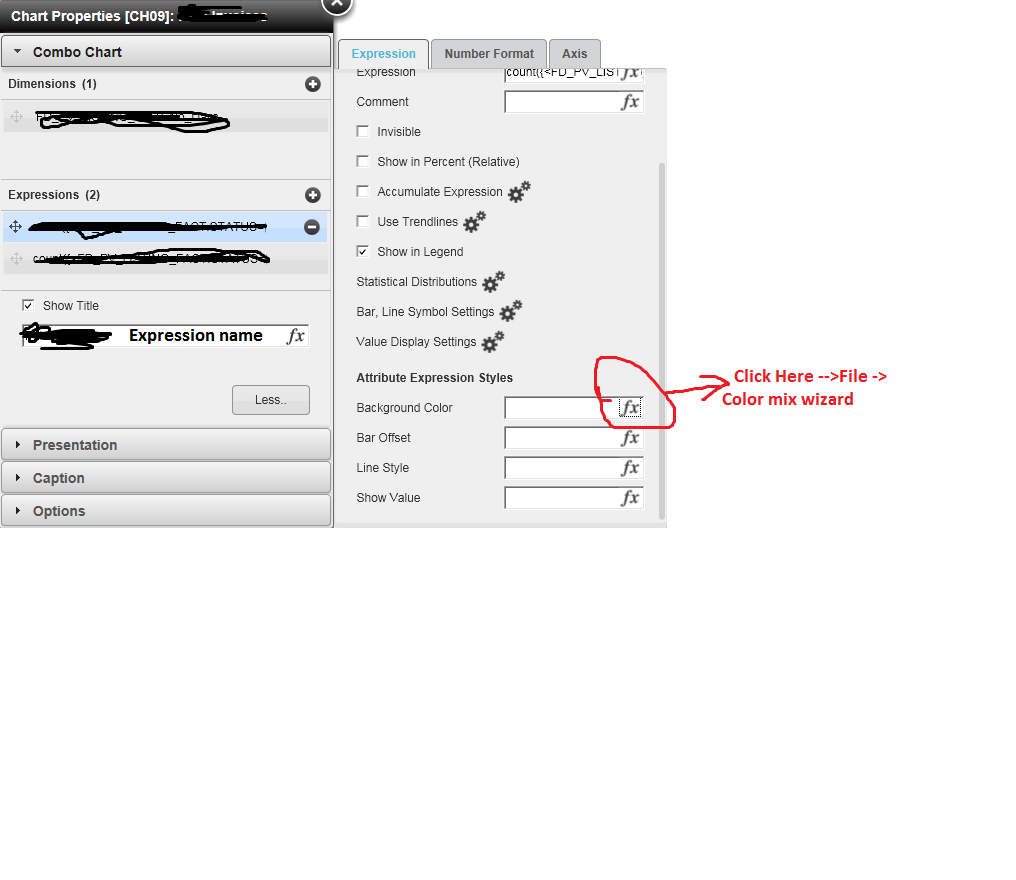
Chart Properties-> Expression -> Edit Expression -> File -> Color Mix Wizard -> Give your expression -> Uncheck Auto Normalize and give your ranges.
Hope this helps you.
Regards,
Jagan.
- Mark as New
- Bookmark
- Subscribe
- Mute
- Subscribe to RSS Feed
- Permalink
- Report Inappropriate Content
Thanks for your suggestion.
I have created this worldmap using Extention,those options are not available.
Thanks,
Raj
- Mark as New
- Bookmark
- Subscribe
- Mute
- Subscribe to RSS Feed
- Permalink
- Report Inappropriate Content
HI ,
try some thing like
