Unlock a world of possibilities! Login now and discover the exclusive benefits awaiting you.
- Qlik Community
- :
- All Forums
- :
- QlikView App Dev
- :
- Re: How to change zoom levels in Google Map?
- Subscribe to RSS Feed
- Mark Topic as New
- Mark Topic as Read
- Float this Topic for Current User
- Bookmark
- Subscribe
- Mute
- Printer Friendly Page
- Mark as New
- Bookmark
- Subscribe
- Mute
- Subscribe to RSS Feed
- Permalink
- Report Inappropriate Content
How to change zoom levels in Google Map?
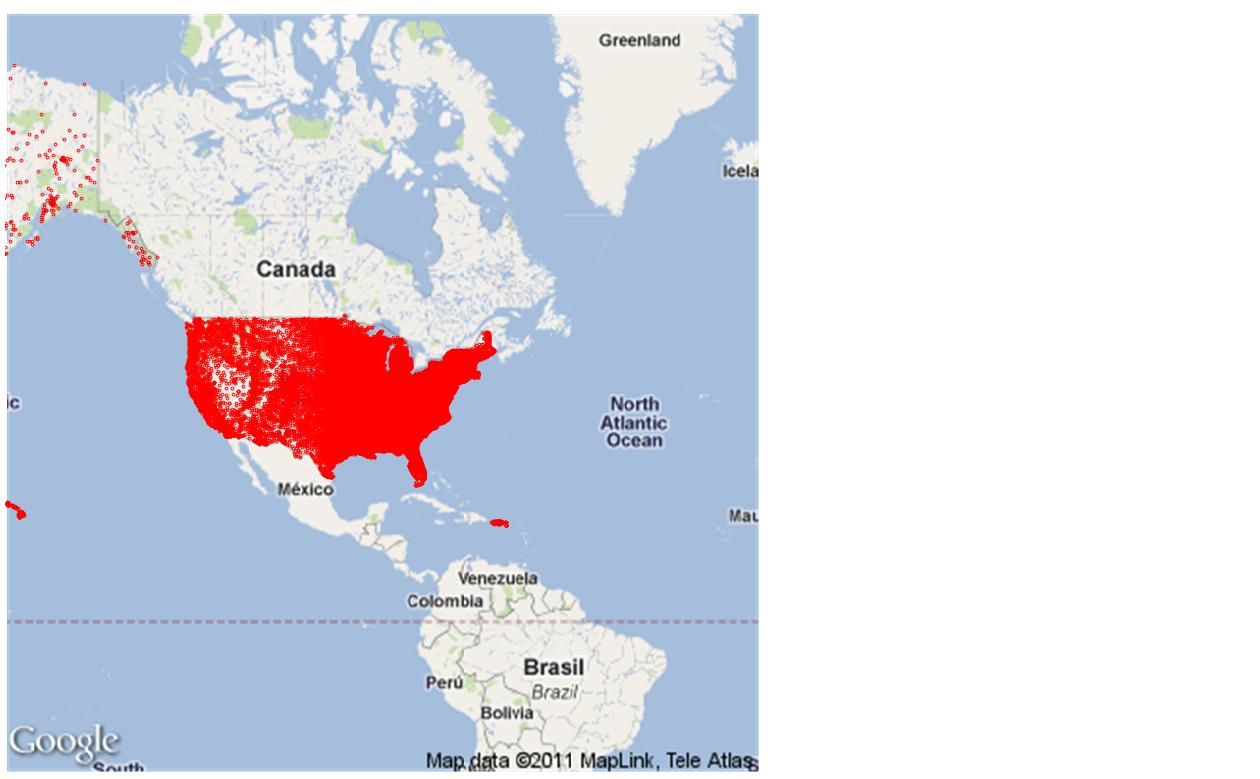
I am currently using a Google map scatter chart, but my data points are plotting to a different zoom level.
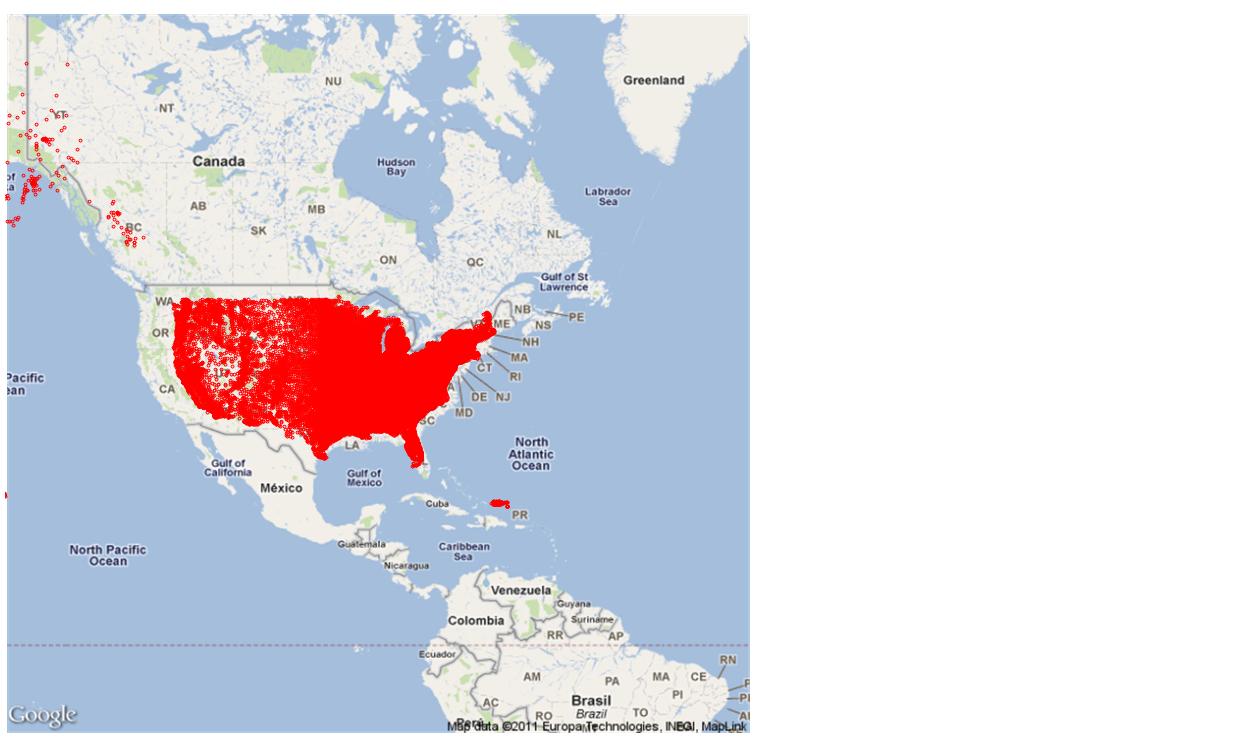
The red should completly overlay the US. How do I change the zoom levels so this is correct?
- « Previous Replies
-
- 1
- 2
- Next Replies »
- Mark as New
- Bookmark
- Subscribe
- Mute
- Subscribe to RSS Feed
- Permalink
- Report Inappropriate Content
map_size_x='757'
map_size_y='757'
- Mark as New
- Bookmark
- Subscribe
- Mute
- Subscribe to RSS Feed
- Permalink
- Report Inappropriate Content
you could play a bit with those values on Min/Max of X/Y axes:
-round(map_size_x/2) // +/- something
+round(map_size_x/2) // +/- something
also a even map size (760) could be a better.
- Ralf
- Mark as New
- Bookmark
- Subscribe
- Mute
- Subscribe to RSS Feed
- Permalink
- Report Inappropriate Content
Well I just got it working. apparently it wants to be set to size 400, even if the actuall chart is not that size.
I changed the def_map_size to 400 and map_size_x and map_size_y to 400 and it is working fine.
I would have thought it would need the map sizes set to the actuall size of the chart but I guess not. Thank you everyone for your help.
- Mark as New
- Bookmark
- Subscribe
- Mute
- Subscribe to RSS Feed
- Permalink
- Report Inappropriate Content
This is a test google maps script, try to paste this script but replace my tables for yours.
I hope it works
Directory
;
LOAD CVE_ENT,
LATITUD as latitude,
LONGITUD as longitude,
Sales
FROM
[Test.xls]
(biff, embedded labels, table is [GeoReferencias de Capitales$]);
Directory ;
LOAD CVE_ENT,
NOM_ENT,
NOM_CAP
FROM
Entities.txt
(txt, codepage is 1252, embedded labels, delimiter is '\t', msq);
// Google Maps in QlikView
// V0.9 - October 1st 2008 © Copyright QlikTech International AB 2008 / AES
// Google Maps Key
// get a key here http://code.google.com/apis/maps/signup.html
gmap_key = 'ABQIAAAAcp0AySnPCjkFsX1ukx37JBRd_q69DwA9dHzVTF_BRL-tjELfnhRLkdiZnQyeO2UGKF2vSlMENmZ5zQ';
max_zoom_level = 5; //maximum value 17
// Variables required for calculating map
// No need to change these
var_pi180= '=pi()/180';
var_lat_offset= '0';
var_mc2= '=256*pow(2,$(var_zoom))';
var_mc1= '=256*pow(2,($(var_zoom)-1))';
var_mid_lat= '=min(latitude)+(1+var_lat_offset)*((max(latitude)-min(latitude))/2)';
var_mid_long= '=min(longitude)+(max(longitude)-min(longitude))/2';
var_zoom= '=max(aggr(if(max( round(256*pow(2,(_zoom_level -1)))+( longitude *((256*pow(2,_zoom_level ))/360)) )-min( round(256*pow(2,(_zoom_level -1)))+( longitude *((256*pow(2,_zoom_level ))/360)) ) <map_size_x AND max((256*pow(2,(_zoom_level-1)))+((0.5*log((1+(sin((latitude)*pi()/180)))/(1-(sin((latitude)*pi()/180)))))*((-256*pow(2,_zoom_level))/(2*pi()))))-min((256*pow(2,(_zoom_level-1)))+((0.5*log((1+(sin((latitude)*pi()/180)))/(1-(sin((latitude)*pi()/180)))))*((-256*pow(2,_zoom_level))/(2*pi()))))<map_size_y,_zoom_level,1),_zoom_level))';
var_maptype= '=if(isnull(only(maptype)),fieldvalue( '&chr(39)&'maptype'&chr(39)&', 1 ),maptype)';
map_size_x= '400';
map_size_y= '400';
SET HidePrefix='_' ;
// Field required for calcualting best zoom level
_zoom_level:
Load RecNo( ) as _zoom_level autogenerate(max_zoom_level);
maptype:
LOAD * INLINE [
maptype
roadmap
mobile
satellite
terrain
hybrid
];
- Mark as New
- Bookmark
- Subscribe
- Mute
- Subscribe to RSS Feed
- Permalink
- Report Inappropriate Content
I'm a bit curious, is it also working if you set this to 800/800? I would expect the picture gets more details..
- Mark as New
- Bookmark
- Subscribe
- Mute
- Subscribe to RSS Feed
- Permalink
- Report Inappropriate Content
No it does not, it has the same zoom issue as what I started with. The code must be specifically edited to work for 400x400
- Mark as New
- Bookmark
- Subscribe
- Mute
- Subscribe to RSS Feed
- Permalink
- Report Inappropriate Content
Interesting. I have some workable examples with different sizes (600x600, 600x400; also for the free OpenStreetMap). You would need to set Width/Height of the chart object (caption tab) indeed...
- Mark as New
- Bookmark
- Subscribe
- Mute
- Subscribe to RSS Feed
- Permalink
- Report Inappropriate Content
You can change the "max_zoom_level" variable in your edit script.
max_zoom_level = 13; //maximum 17
- « Previous Replies
-
- 1
- 2
- Next Replies »