Unlock a world of possibilities! Login now and discover the exclusive benefits awaiting you.
- Qlik Community
- :
- All Forums
- :
- QlikView App Dev
- :
- How to choose two diffrent axis
- Subscribe to RSS Feed
- Mark Topic as New
- Mark Topic as Read
- Float this Topic for Current User
- Bookmark
- Subscribe
- Mute
- Printer Friendly Page
- Mark as New
- Bookmark
- Subscribe
- Mute
- Subscribe to RSS Feed
- Permalink
- Report Inappropriate Content
How to choose two diffrent axis
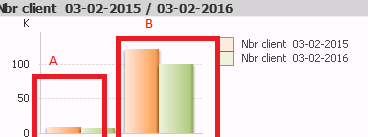
I have the following chart

How to choose two different axis for each group : A and B ?
- Tags:
- new_to_qlikview
- Mark as New
- Bookmark
- Subscribe
- Mute
- Subscribe to RSS Feed
- Permalink
- Report Inappropriate Content
Object Properties -> Axes -> Select any Dimension From Top Left -> Position -> Split Axes -> Right
See the attachement![]()
- Mark as New
- Bookmark
- Subscribe
- Mute
- Subscribe to RSS Feed
- Permalink
- Report Inappropriate Content
Hi Jaweher,
PFA sample. It will be helpful.
Make sure you have more than 1 expression to display value in different axis. You can select right and left from Axis tab.
Regards
KC
KC
- Mark as New
- Bookmark
- Subscribe
- Mute
- Subscribe to RSS Feed
- Permalink
- Report Inappropriate Content
Technically you can't split the dimension values between Left & Right Y-Axis.
But if you have more than one expression, you can plot expression values to different Y-Axis.
- Mark as New
- Bookmark
- Subscribe
- Mute
- Subscribe to RSS Feed
- Permalink
- Report Inappropriate Content
Hi,
May be like this,
Bar Chart:
Dimension:
Your Field
Expressions:
1.
=Sum({<Your Field={'A'}>}Sales)
2.
=Sum({<Your Field={'B'}>}Sales)
For this two Expressions you can split axis in one as Left Bottom and one as Right top.
PFA,
Hope this helps,
Regards,
Hirish