Unlock a world of possibilities! Login now and discover the exclusive benefits awaiting you.
- Qlik Community
- :
- All Forums
- :
- QlikView App Dev
- :
- How to classify data based on percentile
Options
- Subscribe to RSS Feed
- Mark Topic as New
- Mark Topic as Read
- Float this Topic for Current User
- Bookmark
- Subscribe
- Mute
- Printer Friendly Page
Turn on suggestions
Auto-suggest helps you quickly narrow down your search results by suggesting possible matches as you type.
Showing results for
Anonymous
Not applicable
2018-08-28
11:49 PM
- Mark as New
- Bookmark
- Subscribe
- Mute
- Subscribe to RSS Feed
- Permalink
- Report Inappropriate Content
How to classify data based on percentile
Hi:
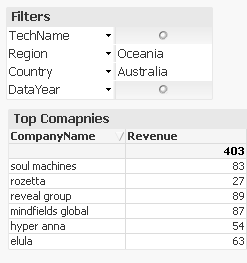
I have a question regarding classifying companies based on their revenue. . Following is my data
What I want is that,
- Based on what I select in Filters (TechName, Region, Country and DataYear) some companies are short listed.
- Then I want to rank those companies based on their revenue percentile, as " 3 = High, 2 = Med and 1 = Low", as follows, ,
- If(revenuePercentile > .75, 3, if(revenuePercentile < .25, 1, 2))
- Question is how can I calculate the revenuePercentile that's also dynamically updated based on group of companies being filtered.
I am quite new and any detailed solution/help will be highly appreciated. I tried using fractile() function but can't really figure out as how to use it.
954 Views
1 Reply
Anonymous
Not applicable
2018-08-28
11:58 PM
Author
- Mark as New
- Bookmark
- Subscribe
- Mute
- Subscribe to RSS Feed
- Permalink
- Report Inappropriate Content
I am adding an expression in the above straight chart as follow,
if(Revenue>=Fractile(Total Revenue, 0.75), 3,
if(Revenue<Fractile(Total Revenue, 0.25), 1, 2))
Does it make sense,  , if not then what's the best way to do this?
918 Views