Unlock a world of possibilities! Login now and discover the exclusive benefits awaiting you.
- Qlik Community
- :
- All Forums
- :
- QlikView App Dev
- :
- How to club Dimension and get the out put results
- Subscribe to RSS Feed
- Mark Topic as New
- Mark Topic as Read
- Float this Topic for Current User
- Bookmark
- Subscribe
- Mute
- Printer Friendly Page
- Mark as New
- Bookmark
- Subscribe
- Mute
- Subscribe to RSS Feed
- Permalink
- Report Inappropriate Content
How to club Dimension and get the out put results
Hello experts,
I am working on some data where count of actions mentioned with their respective outcome. And I want to present 5 times action and incase if comeone has mor ethan that it should come along with 5th column as 5+
Look at this example.
| Days | Production | Sale |
| 1 | 927 | 836 |
| 2 | 506 | 706 |
| 3 | 937 | 712 |
| 4 | 872 | 839 |
| 5 | 729 | 776 |
| 6 | 881 | 868 |
| 7 | 750 | 717 |
| 8 | 880 | 725 |
| 9 | 557 | 991 |
| 10 | 525 | 797 |
| 11 | 559 | 614 |
| 12 | 1000 | 771 |
If in the above table i would like to show days as 1,2,3 & 4 individually and rest as 5+
then how should i present them in chart
Kindly help
Regards
- Tags:
- qlikview_query
- « Previous Replies
-
- 1
- 2
- Next Replies »
- Mark as New
- Bookmark
- Subscribe
- Mute
- Subscribe to RSS Feed
- Permalink
- Report Inappropriate Content
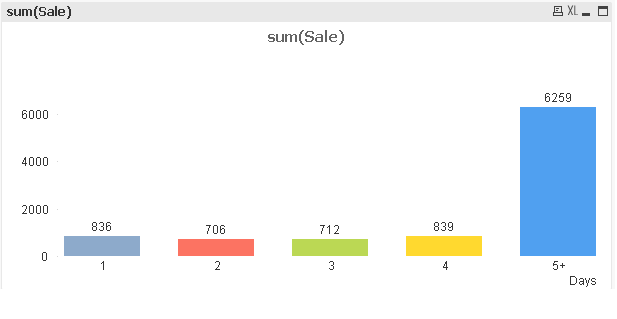
Use a calculated dimension as chart dimension: =if(Days<5,Days, '5+')
talk is cheap, supply exceeds demand
- Mark as New
- Bookmark
- Subscribe
- Mute
- Subscribe to RSS Feed
- Permalink
- Report Inappropriate Content
Find the attached file:
- Mark as New
- Bookmark
- Subscribe
- Mute
- Subscribe to RSS Feed
- Permalink
- Report Inappropriate Content
A snapshot of my solution:
- Mark as New
- Bookmark
- Subscribe
- Mute
- Subscribe to RSS Feed
- Permalink
- Report Inappropriate Content
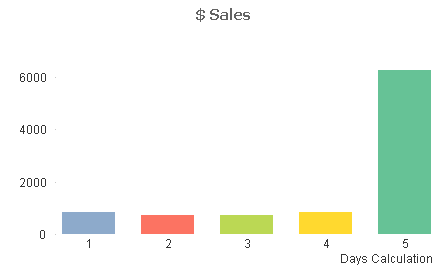
what about if i want the latest data of last 5 months not later than that
- Mark as New
- Bookmark
- Subscribe
- Mute
- Subscribe to RSS Feed
- Permalink
- Report Inappropriate Content
Like this?
- Mark as New
- Bookmark
- Subscribe
- Mute
- Subscribe to RSS Feed
- Permalink
- Report Inappropriate Content
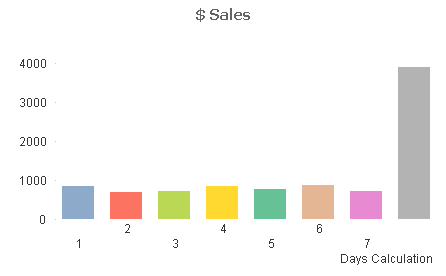
Or this?
- Mark as New
- Bookmark
- Subscribe
- Mute
- Subscribe to RSS Feed
- Permalink
- Report Inappropriate Content
Its correct yes this is how i want
If i am not wrong.
in this data if further more days will be added like 13 to 16
then i will get data from 12 13 14 15 16
If correct then let me know how to do it.
- Mark as New
- Bookmark
- Subscribe
- Mute
- Subscribe to RSS Feed
- Permalink
- Report Inappropriate Content
 M
M
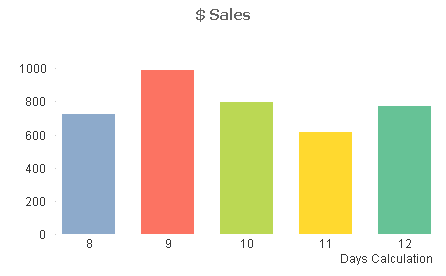
May be Like this , PFA
- Mark as New
- Bookmark
- Subscribe
- Mute
- Subscribe to RSS Feed
- Permalink
- Report Inappropriate Content
Is this what you're looking for?
- « Previous Replies
-
- 1
- 2
- Next Replies »