Unlock a world of possibilities! Login now and discover the exclusive benefits awaiting you.
- Qlik Community
- :
- All Forums
- :
- QlikView App Dev
- :
- Re: How to color column header in this format
- Subscribe to RSS Feed
- Mark Topic as New
- Mark Topic as Read
- Float this Topic for Current User
- Bookmark
- Subscribe
- Mute
- Printer Friendly Page
- Mark as New
- Bookmark
- Subscribe
- Mute
- Subscribe to RSS Feed
- Permalink
- Report Inappropriate Content
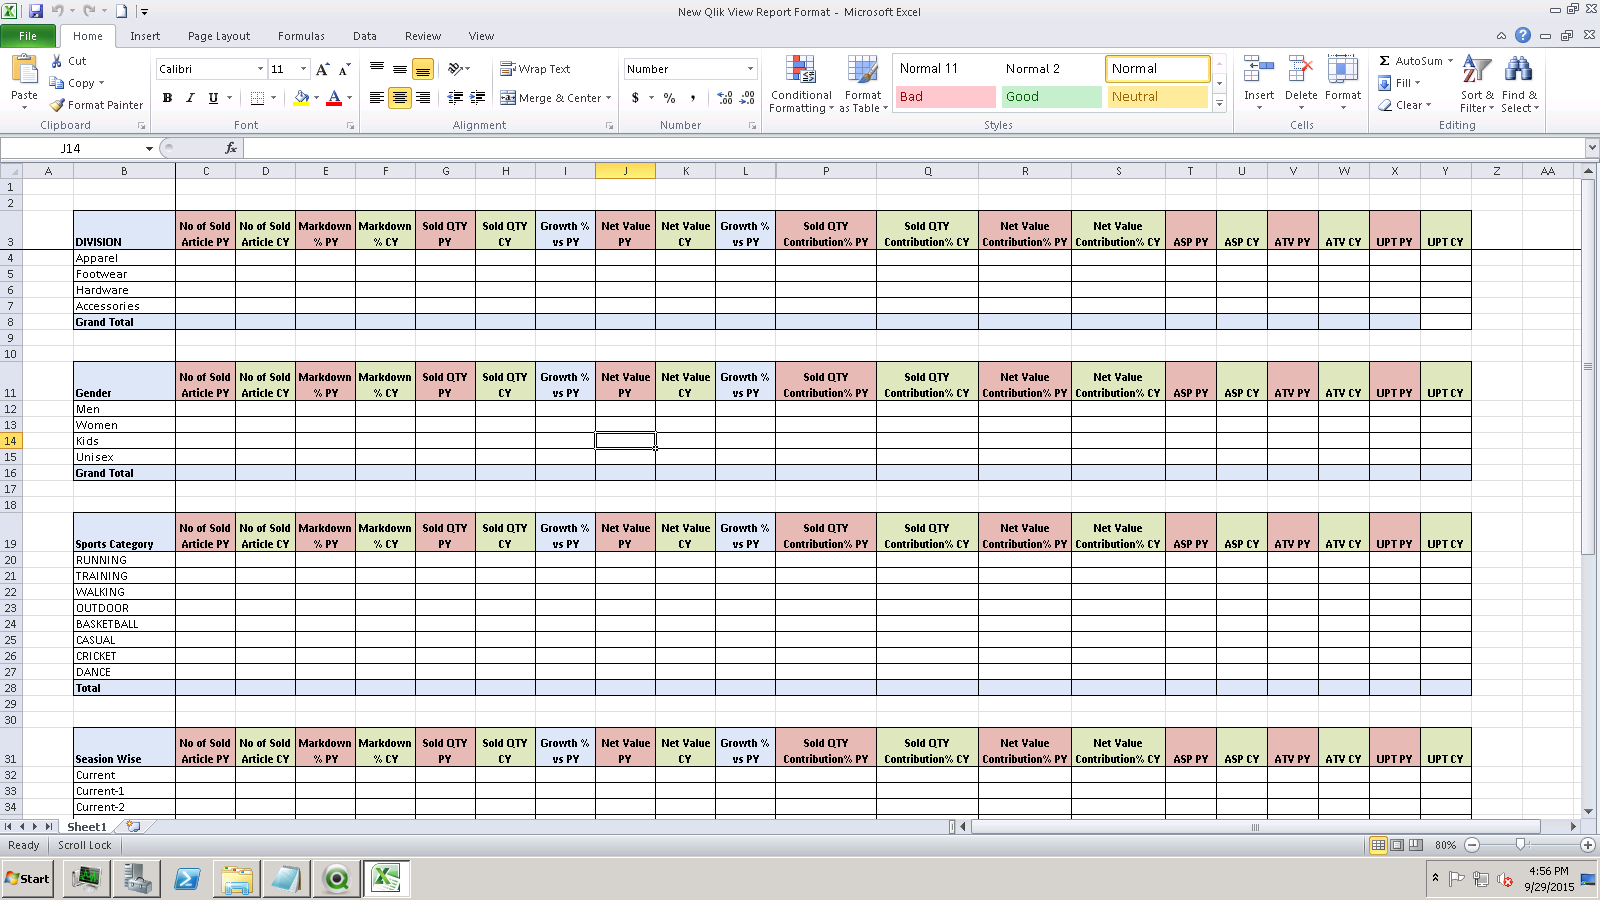
How to color column header in this format
- Tags:
- new_to_qlikview
- « Previous Replies
-
- 1
- 2
- Next Replies »
- Mark as New
- Bookmark
- Subscribe
- Mute
- Subscribe to RSS Feed
- Permalink
- Report Inappropriate Content
Hi Balkumar,
Steps:
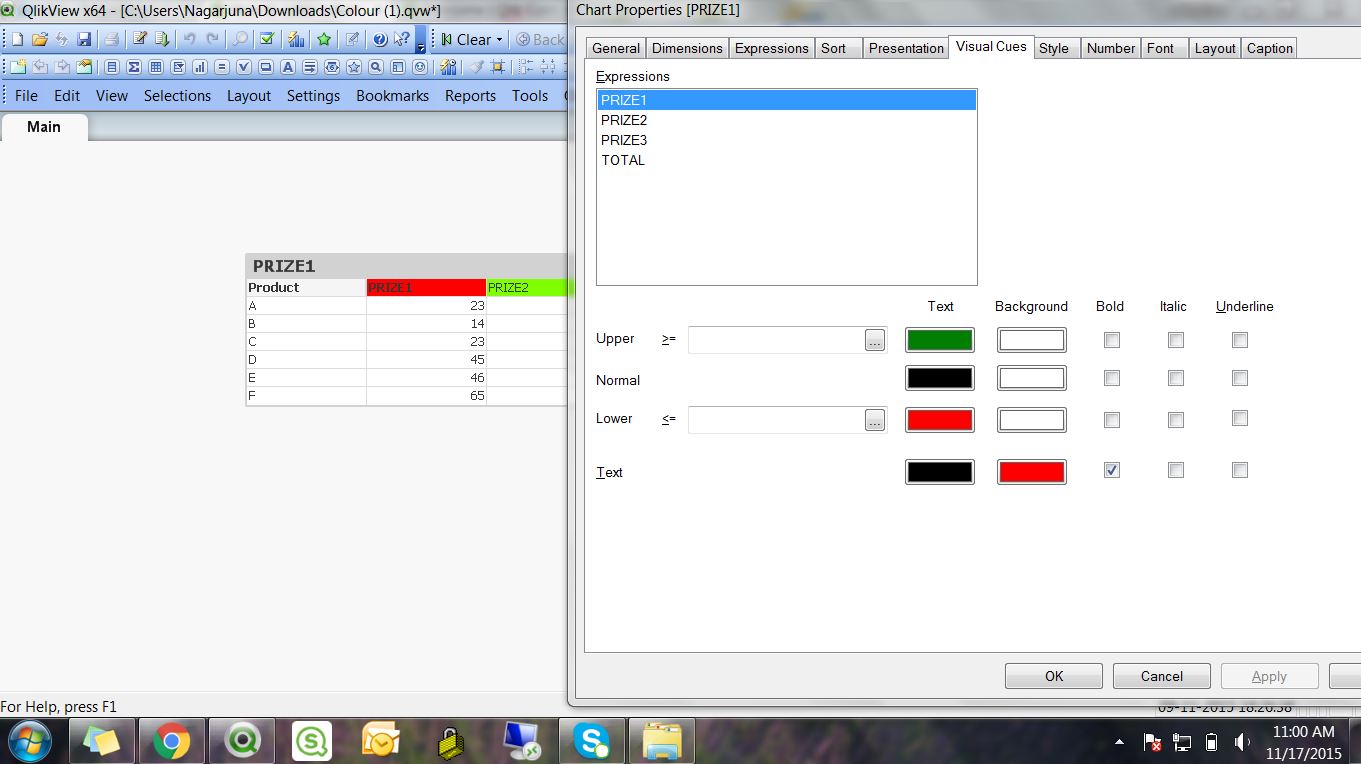
1.Open your Pivot Table Go to Properties>>Visual Cues>>In the Background >>Last Box of Colour , change as per your colour. before applying colour select your Column left hand side.
2.Apply it.
Regards,
Nagarjuna
- Mark as New
- Bookmark
- Subscribe
- Mute
- Subscribe to RSS Feed
- Permalink
- Report Inappropriate Content
- Mark as New
- Bookmark
- Subscribe
- Mute
- Subscribe to RSS Feed
- Permalink
- Report Inappropriate Content
Helpful
- Mark as New
- Bookmark
- Subscribe
- Mute
- Subscribe to RSS Feed
- Permalink
- Report Inappropriate Content
hi Nagarguna,
Thank you very much for your help. when I use it for numeric expression it working fine but when I am trying to put some symbol in expression color is changing for hole column (Header and column values) . It should only change color for Column Header A .
Please advice . Thanks BKC
- Mark as New
- Bookmark
- Subscribe
- Mute
- Subscribe to RSS Feed
- Permalink
- Report Inappropriate Content
Hi Balkumar,
I didn't understand properly.Can you explain little more and sample output.
Regards,
Nagarjuna
- Mark as New
- Bookmark
- Subscribe
- Mute
- Subscribe to RSS Feed
- Permalink
- Report Inappropriate Content
When I am using sum(col1) or any numeric expression I am able to change header color for that particular expression.
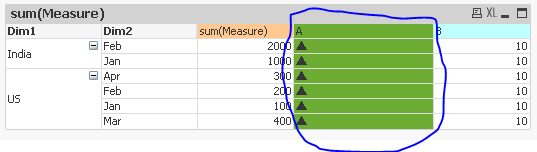
But when I am trying to put any symbol like '↓' or '→' or image in expression and changing the color of header
Its not working QlikView is applying this color to Header as well as data cells.
You can see above screenshot fourth column A is having green color for Header as well as cells . Header should be green like other columns(Third and fifth ) and other cells should be white (below Header data part)
Thanks,
BKC
- Mark as New
- Bookmark
- Subscribe
- Mute
- Subscribe to RSS Feed
- Permalink
- Report Inappropriate Content
You can get rid of the colour in the expression column where there is either an image or no data with an if statement on the background colour of the expression (using the little plus sign to expand it). If you are using show partial sums on the pivot table then use Dimensionality to not overwrite the colour of the "total" line.
e.g.
if(Dimensionality() > 1 , white(), //this does not change the total line (I only have 2 levels in my pivot table)
if(Dimensionality() = 1 and (Column(7) = 0 or IsNum(Column(7)) = 0), rgb(243,243,243),
white()
)
)
- « Previous Replies
-
- 1
- 2
- Next Replies »