Unlock a world of possibilities! Login now and discover the exclusive benefits awaiting you.
- Qlik Community
- :
- All Forums
- :
- QlikView App Dev
- :
- How to combine rows or columns of excel data in ql...
- Subscribe to RSS Feed
- Mark Topic as New
- Mark Topic as Read
- Float this Topic for Current User
- Bookmark
- Subscribe
- Mute
- Printer Friendly Page
- Mark as New
- Bookmark
- Subscribe
- Mute
- Subscribe to RSS Feed
- Permalink
- Report Inappropriate Content
How to combine rows or columns of excel data in qlik
Let's say I have a spreadsheet that looks something like this:
| WO# | Work Type | LABCOST | OHCOST |
|---|---|---|---|
111 | PM | 100 | 50 |
| 112 | PM | 0 | 100 |
| 113 | CM | 200 | 200 |
| 114 | LB | 0 | 400 |
| 115 | IS | 50 | 0 |
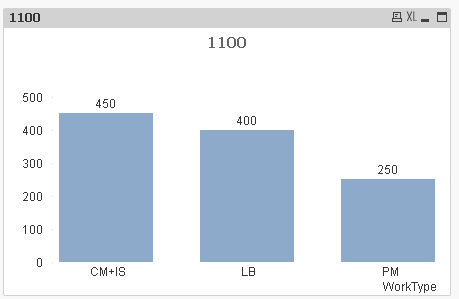
If I wanted to make a bar graph that compares the sum of the costs of each Work Type, how can I make qlikview sum LABCOST and OHCOST without making another column in my spreadsheet (so the sum of the costs would be 250 for PM, 400 for CM, etc.). Also, How could I combine CM and IS in qlikview so when I made a similar bar graph it would show the costs for PM, LB, and a third Work Type that is a combo of CM and IS? My spreadsheet has >500,000 rows of data, so making these changes in excel would be a pain...
Accepted Solutions
- Mark as New
- Bookmark
- Subscribe
- Mute
- Subscribe to RSS Feed
- Permalink
- Report Inappropriate Content
Something like this?
Load the data from Excel File like below change the path accordingly.
LOAD
WO#, WorkType, LABCOST, OHCOST
FROM Excelfilename.xlsx;
Create a bar chart :
Dim: = IF(Match(WorkType, 'CM', 'IS'), 'CM+IS', WorkType)
Expr: = = Sum( LABCOST + OHCOST)
- Mark as New
- Bookmark
- Subscribe
- Mute
- Subscribe to RSS Feed
- Permalink
- Report Inappropriate Content
If I wanted to make a bar graph that compares the sum of the costs of each Work Type, how can I make qlikview sum LABCOST and OHCOST
Sum(RangeSum(LABCOST,OHCOST))
How could I combine CM and IS in qlikview
Create a new table with a new dimension:
LOAD * INLINE [
WorkTypeGroup, Work Type
PM, PM
CM, CM
CM, IS
LB, LB
];
Then use the new WorkTypeGroup as dimension instead of [Work Type]
talk is cheap, supply exceeds demand
- Mark as New
- Bookmark
- Subscribe
- Mute
- Subscribe to RSS Feed
- Permalink
- Report Inappropriate Content
New question that is kinda related to the last one. I have a very large excel sheet that I am loading into qlik. There is a column heading called "PERSONGROUP" that has about 50-60 different inputs which should really be grouped into about 10-15 input groups (i.e. 'IC', 'IC1', 'IC2', 'IC3' should be 'IC' and 'FAC', 'FAC1' should be 'FAC', etc.). What do I need to do so that all of these inputs are grouped together the way I want them to be? I tried using multiple dimensions with the =if(match(...)) that Vish suggested to use in the chart script, but that only worked for combining one group...
- Mark as New
- Bookmark
- Subscribe
- Mute
- Subscribe to RSS Feed
- Permalink
- Report Inappropriate Content
Ok Use what gysbert suggested like create an Inline table with all mapping then use that the dimensions as
WorkTypeGroup removing If(Match...()).