Unlock a world of possibilities! Login now and discover the exclusive benefits awaiting you.
- Qlik Community
- :
- All Forums
- :
- QlikView App Dev
- :
- How to compare the value in the next column in str...
- Subscribe to RSS Feed
- Mark Topic as New
- Mark Topic as Read
- Float this Topic for Current User
- Bookmark
- Subscribe
- Mute
- Printer Friendly Page
- Mark as New
- Bookmark
- Subscribe
- Mute
- Subscribe to RSS Feed
- Permalink
- Report Inappropriate Content
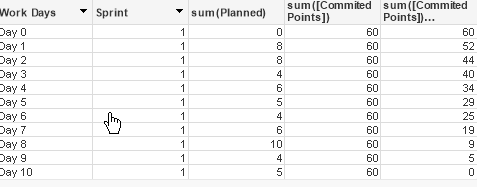
How to compare the value in the next column in straight table?
Hello All,
I have data like below -
| Sprint | Work Days | Planned | Commited Points | Output |
| 1 | Day 0 | 0 | 60 | 60 |
| 1 | Day 1 | 8 | 60 | 52 |
| 1 | Day 2 | 8 | 60 | 44 |
| 1 | Day 3 | 4 | 60 | 40 |
| 1 | Day 4 | 6 | 60 | 34 |
| 1 | Day 5 | 5 | 60 | 29 |
| 1 | Day 6 | 4 | 60 | 25 |
| 1 | Day 7 | 6 | 60 | 19 |
| 1 | Day 8 | 10 | 60 | 9 |
| 1 | Day 9 | 4 | 60 | 5 |
| 1 | Day 10 | 5 | 60 | 0 |
Output Column Calculation : For Days 0, Committed Points - Planned = 60 - 0 = 60,
For Days 1 , Output Column first value(60) needs to be compared with second row of planned (8) -> 60 - 8 = 52.
For days 2 Output Column second value (52) needs to be compared with third row of planned (8) -> 52 - 8 = 44.
How to achieve the values that are showing in the output column in Qlikview?
- Tags:
- qlik
Accepted Solutions
- Mark as New
- Bookmark
- Subscribe
- Mute
- Subscribe to RSS Feed
- Permalink
- Report Inappropriate Content
maybe (chart with Work Days and Sprint as dimensions)
sum([Commited Points])
- rangesum(Above( total sum(Planned), 0, RowNo(TOTAL)))
- Mark as New
- Bookmark
- Subscribe
- Mute
- Subscribe to RSS Feed
- Permalink
- Report Inappropriate Content
maybe (chart with Work Days and Sprint as dimensions)
sum([Commited Points])
- rangesum(Above( total sum(Planned), 0, RowNo(TOTAL)))
- Mark as New
- Bookmark
- Subscribe
- Mute
- Subscribe to RSS Feed
- Permalink
- Report Inappropriate Content
Thanks a lot !!
Nisha