Unlock a world of possibilities! Login now and discover the exclusive benefits awaiting you.
- Qlik Community
- :
- All Forums
- :
- QlikView App Dev
- :
- Re: How to compute CY vs LY accumulated % var to m...
- Subscribe to RSS Feed
- Mark Topic as New
- Mark Topic as Read
- Float this Topic for Current User
- Bookmark
- Subscribe
- Mute
- Printer Friendly Page
- Mark as New
- Bookmark
- Subscribe
- Mute
- Subscribe to RSS Feed
- Permalink
- Report Inappropriate Content
How to compute CY vs LY accumulated % var to make it display +4% ?
Hi All
Below expression plot the CY line chart :-
Money(RangeSum(Above(TOTAL Sum(DISTINCT{<year = {"$(=Max(year)-0)"},$(ColumnDim51) ={$(ColumnDim51)}>} Amount*1/ $(Columndim89)/1000), 0, RowNo(TOTAL))), $(vMoneyFormatK))
Below expression plot the PY line chart :-
Money(RangeSum(Above(TOTAL Sum(DISTINCT{<year = {"$(=Max(year)-1)"},$(ColumnDim51) ={$(ColumnDim51)}>} Amount*1/ $(Columndim89)/1000), 0, RowNo(TOTAL))), $(vMoneyFormatK))
I try to create % Var line using below expression :-
(
(
(
Money(RangeSum(Above(TOTAL Sum(DISTINCT{<year = {"$(=Max(year)-0)"},$(ColumnDim51) ={$(ColumnDim51)}>} Amount*1/ $(Columndim89)/1000), 0, RowNo(TOTAL))), $(vMoneyFormatK))
)
/
(
Money(RangeSum(Above(TOTAL Sum(DISTINCT{<year = {"$(=Max(year)-1)"},$(ColumnDim51) ={$(ColumnDim51)}>} Amount*1/ $(Columndim89)/1000), 0, RowNo(TOTAL))), $(vMoneyFormatK))
)
)
-1)*1
The end % i get equal -376% which is wrong , may i know how to get +4 % ?
Paul
- Tags:
- qlikview_scripting
Accepted Solutions
- Mark as New
- Bookmark
- Subscribe
- Mute
- Subscribe to RSS Feed
- Permalink
- Report Inappropriate Content
Why don't you try with your label of your expression? Like
(CY/PY-1)*1
And, Check the 'No Accumulation' in Expression Tab.
- Mark as New
- Bookmark
- Subscribe
- Mute
- Subscribe to RSS Feed
- Permalink
- Report Inappropriate Content
Why don't you try with your label of your expression? Like
(CY/PY-1)*1
And, Check the 'No Accumulation' in Expression Tab.
- Mark as New
- Bookmark
- Subscribe
- Mute
- Subscribe to RSS Feed
- Permalink
- Report Inappropriate Content
Hi Settu
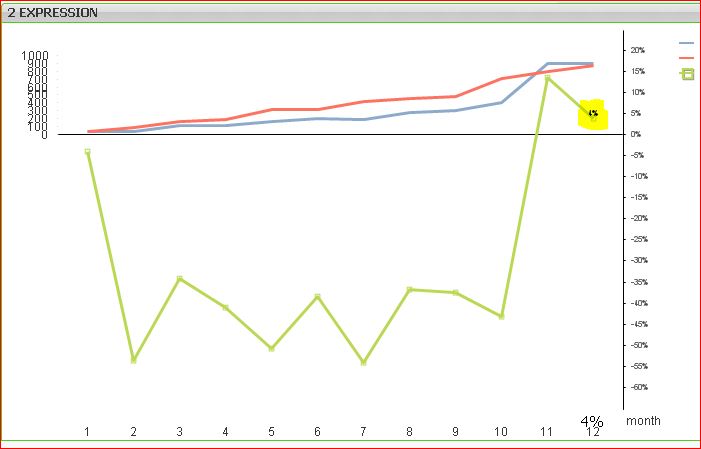
You got it right . Thank you . may i know how to make the % Var Y Axis scale start from -60% ( as zero level ) . So that the var % will be supper impose at CY & PY line. i mean all 3 line in 1 area , right now the chart look a bit funny.
Paul
- Mark as New
- Bookmark
- Subscribe
- Mute
- Subscribe to RSS Feed
- Permalink
- Report Inappropriate Content
 H
H
How to make it Look some thing like this.
- Mark as New
- Bookmark
- Subscribe
- Mute
- Subscribe to RSS Feed
- Permalink
- Report Inappropriate Content
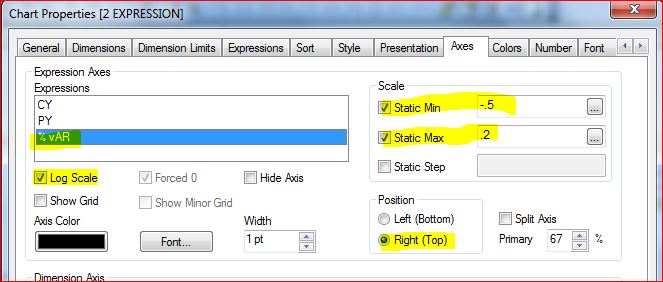
Hi Paul,
Already i tried to do that what you have said with combo chart..
Right Axis as Variance %. But no luck. Will check that again..
- Mark as New
- Bookmark
- Subscribe
- Mute
- Subscribe to RSS Feed
- Permalink
- Report Inappropriate Content
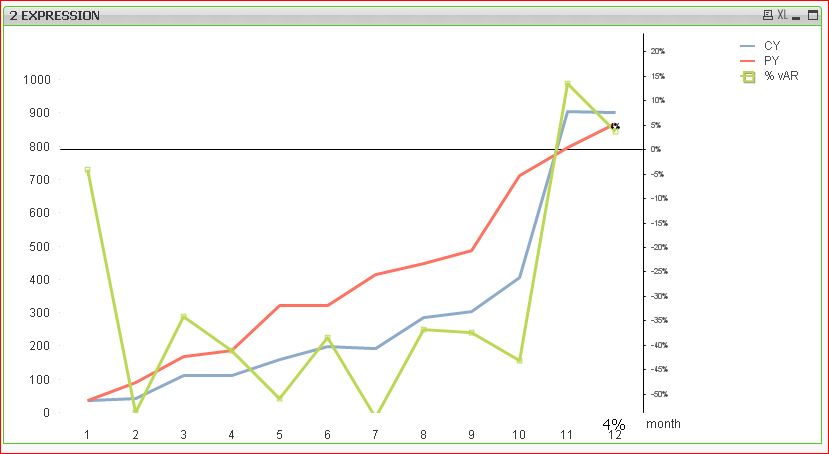
Hi,
How is this one?
- Mark as New
- Bookmark
- Subscribe
- Mute
- Subscribe to RSS Feed
- Permalink
- Report Inappropriate Content
Hi SEttu
Thank you very much , it work fine now.
I try to create the % var expression , but it does not work , can you advise me why ? As i need to apply in QS using the expression.
rangesum(above(
Sum(DISTINCT{<year = {"$(=Max(year)-0)"},$(ColumnDim51) ={$(ColumnDim51)}>} Amount*1/ $(Columndim89)/1000
,0,rowno())) /
rangesum(above(
Sum(DISTINCT{<year = {"$(=Max(year)-1)"},$(ColumnDim51) ={$(ColumnDim51)}>} Amount*1/ $(Columndim89)/1000
,0,rowno())) -1
Paul
- Mark as New
- Bookmark
- Subscribe
- Mute
- Subscribe to RSS Feed
- Permalink
- Report Inappropriate Content
Hi Paul,
Did you try the already suggested expression? It's working fine for me..
(CY/PY-1)*1
- Mark as New
- Bookmark
- Subscribe
- Mute
- Subscribe to RSS Feed
- Permalink
- Report Inappropriate Content
Yes it fine too. Thank you