Unlock a world of possibilities! Login now and discover the exclusive benefits awaiting you.
- Qlik Community
- :
- All Forums
- :
- QlikView App Dev
- :
- Re: Re: Re: How to count/group no. of users based ...
- Subscribe to RSS Feed
- Mark Topic as New
- Mark Topic as Read
- Float this Topic for Current User
- Bookmark
- Subscribe
- Mute
- Printer Friendly Page
- Mark as New
- Bookmark
- Subscribe
- Mute
- Subscribe to RSS Feed
- Permalink
- Report Inappropriate Content
How to count/group no. of users based on their active months usage?
Hi folks,
Could someone help me out with an issue at hand. Please take a look at the picture below:
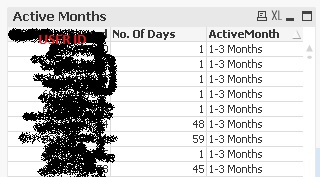
So the columns are the userID, the no. of days the user has been actively using a particular service and a grouping field to group the users based on their usage - in active months. I would like to group this users for e.g., if there are 10 users that fall into the 1-3 months category, I would like to group them all together and place it into a chart/table to show that there are 10 users whom fall into the 1-3 months category, so on and so forth.
Hope ya'll get the picture, if you guys require further clarification please do let me know. Thanks. Cheers.
Best Regards,
R
- Tags:
- qlikview_scripting
Accepted Solutions
- Mark as New
- Bookmark
- Subscribe
- Mute
- Subscribe to RSS Feed
- Permalink
- Report Inappropriate Content
- Mark as New
- Bookmark
- Subscribe
- Mute
- Subscribe to RSS Feed
- Permalink
- Report Inappropriate Content
HI,
Use ActiveMonth as dimension and use Count(DISTINCT UserID) as expression. This groups the users by ActiveMonth.
Regards,
Jagan.
- Mark as New
- Bookmark
- Subscribe
- Mute
- Subscribe to RSS Feed
- Permalink
- Report Inappropriate Content
Thanks Jagan, will try it out. Let you know how it goes.
- Mark as New
- Bookmark
- Subscribe
- Mute
- Subscribe to RSS Feed
- Permalink
- Report Inappropriate Content
Hi Jagan Mohan - it's not working as claimed. Any other ideas?
- Mark as New
- Bookmark
- Subscribe
- Mute
- Subscribe to RSS Feed
- Permalink
- Report Inappropriate Content
Hi,
It should work as expected. Can you attach some sample file and expected output, it helps in providing solution easier.
Regards,
Jagan.
- Mark as New
- Bookmark
- Subscribe
- Mute
- Subscribe to RSS Feed
- Permalink
- Report Inappropriate Content
Hi Jagan,
I will work on one right now and post it up right away.
Thanks.
Best Regards,
R
- Mark as New
- Bookmark
- Subscribe
- Mute
- Subscribe to RSS Feed
- Permalink
- Report Inappropriate Content
- Mark as New
- Bookmark
- Subscribe
- Mute
- Subscribe to RSS Feed
- Permalink
- Report Inappropriate Content
Hi,
PFA file for solution.
Regards,
Jagan.
- Mark as New
- Bookmark
- Subscribe
- Mute
- Subscribe to RSS Feed
- Permalink
- Report Inappropriate Content
Hi Jagan Mohan
- Sorry man, am unable to open .qvw files as am still using the free edition. Could you please post the script up for me?
Thanks a bunch, sorry for the hassle.
- Mark as New
- Bookmark
- Subscribe
- Mute
- Subscribe to RSS Feed
- Permalink
- Report Inappropriate Content
Hi,
In Straight Table ->
Dimension - ActiveMths_Grp
Expression - =Count(DISTINCT UserID)
Regards,
Jagan.