Unlock a world of possibilities! Login now and discover the exclusive benefits awaiting you.
- Qlik Community
- :
- All Forums
- :
- QlikView App Dev
- :
- How to count no. of occurrence above & below avera...
- Subscribe to RSS Feed
- Mark Topic as New
- Mark Topic as Read
- Float this Topic for Current User
- Bookmark
- Subscribe
- Mute
- Printer Friendly Page
- Mark as New
- Bookmark
- Subscribe
- Mute
- Subscribe to RSS Feed
- Permalink
- Report Inappropriate Content
How to count no. of occurrence above & below average?
Hi All,
I'm new to the qlikview. I have this kind of data. Just a simple one :
Month Group Productivity
A A1 0
A A2 0
A A1 0.2
A A1 1.4
A A2 1.8
A A1 2.3
I want to calculate the average for column 'Productivity' for each Group by excluding the data which has value 0. After that, I want to count the number of occurrence that above the average for each group.
Please suggest how I can solve this problem.
Thank you
Accepted Solutions
- Mark as New
- Bookmark
- Subscribe
- Mute
- Subscribe to RSS Feed
- Permalink
- Report Inappropriate Content
Hi,
Hopefully the attached document will help, these are the formula to work it out overall
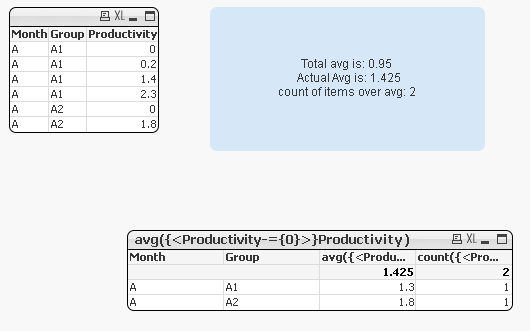
Actual Avg is: avg({<Productivity-={0}>}Productivity)
Count of items over avg: count({<Productivity={">=$(=avg({<Productivity-={0}>}Productivity))"}>} Month)
*edit* I just added the table which will show your required results by group
Please remember to mark this as helpful or the correct answer if I have helped you or answered your question.
This will help users identify the answers should they come across this thread in the future.
- Mark as New
- Bookmark
- Subscribe
- Mute
- Subscribe to RSS Feed
- Permalink
- Report Inappropriate Content
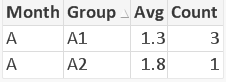
Is this you are expecting from given data
- Mark as New
- Bookmark
- Subscribe
- Mute
- Subscribe to RSS Feed
- Permalink
- Report Inappropriate Content
Hi,
Hopefully the attached document will help, these are the formula to work it out overall
Actual Avg is: avg({<Productivity-={0}>}Productivity)
Count of items over avg: count({<Productivity={">=$(=avg({<Productivity-={0}>}Productivity))"}>} Month)
*edit* I just added the table which will show your required results by group
Please remember to mark this as helpful or the correct answer if I have helped you or answered your question.
This will help users identify the answers should they come across this thread in the future.
- Mark as New
- Bookmark
- Subscribe
- Mute
- Subscribe to RSS Feed
- Permalink
- Report Inappropriate Content
Thank you so much Adam. Your answer helps a lot.