Unlock a world of possibilities! Login now and discover the exclusive benefits awaiting you.
- Qlik Community
- :
- All Forums
- :
- QlikView App Dev
- :
- How to count "Yes" from the cells in different col...
- Subscribe to RSS Feed
- Mark Topic as New
- Mark Topic as Read
- Float this Topic for Current User
- Bookmark
- Subscribe
- Mute
- Printer Friendly Page
- Mark as New
- Bookmark
- Subscribe
- Mute
- Subscribe to RSS Feed
- Permalink
- Report Inappropriate Content
How to count "Yes" from the cells in different column?
Hello guys I need a little help.
I have this example table:
| User | ||||
|---|---|---|---|---|
A | Yes | Yes | No | No |
| B | Yes | Yes | Yes | Yes |
| C | No | Yes | No | Yes |
| D | Yes | No | Yes | No |
How can I count "Yes" from this four different columns?
- « Previous Replies
-
- 1
- 2
- Next Replies »
- Mark as New
- Bookmark
- Subscribe
- Mute
- Subscribe to RSS Feed
- Permalink
- Report Inappropriate Content
You can either use CrossTable Load to transpose your data (The Crosstable Load)
Table:
CrossTable(Platform, Response)
LOAD User,
Facebook,
Linkedin,
Twitter,
FROM ....;
and then you can do like this:
Count({<Response = {'Yes'}>} Response)
If you don't wish to transpose your data, you can do like this:
RangeSum(
Count({<Facebook = {'Yes'}>} Facebook),
Count({<Linkedin = {'Yes'}>} Linkedin),
Count({<Twitter = {'Yes'}>} Twitter),
Count({<Instagram = {'Yes'}>} Instagram))
- Mark as New
- Bookmark
- Subscribe
- Mute
- Subscribe to RSS Feed
- Permalink
- Report Inappropriate Content
in a str table with user as dimension you can try the expression
SubStringCount(Facebook & Instagram & Linkedin & Twitter, 'Yes')
- Mark as New
- Bookmark
- Subscribe
- Mute
- Subscribe to RSS Feed
- Permalink
- Report Inappropriate Content
Note that the transposed data can be in addition to the current data. Each model of the data supports different sorts of requirements. But often a single model can suffice in a given application.
- Mark as New
- Bookmark
- Subscribe
- Mute
- Subscribe to RSS Feed
- Permalink
- Report Inappropriate Content
Thanks buddy. It works.
- Mark as New
- Bookmark
- Subscribe
- Mute
- Subscribe to RSS Feed
- Permalink
- Report Inappropriate Content
Nice. I'm guessing User won't be the dimension, but of course you can wrap it in a sum(aggr(...,User)).
sum(aggr(SubStringCount(Facebook & Instagram & Linkedin & Twitter, 'Yes'),User))
And because it amuses me, this silly expression works too, but I'm not suggesting it - just amused by it.
-sum(pick(valueloop(1,4),Facebook='Yes',Linkedin='Yes',Twitter='Yes',Instagram='Yes'))
But I'd probably stick with Sunny's expression if performance matters and you can't change the data model. Else I'd do the crosstable load as he suggested.
Edit: Or this, but again, not a suggestion, just amusing myself.
-sum(aggr(rangesum(Facebook='Yes',Linkedin='Yes',Twitter='Yes',Instagram='Yes'),User))
- Mark as New
- Bookmark
- Subscribe
- Mute
- Subscribe to RSS Feed
- Permalink
- Report Inappropriate Content
Hi,
another solution, in case the field names of interest may vary but are located in one table, might be:
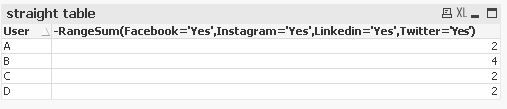
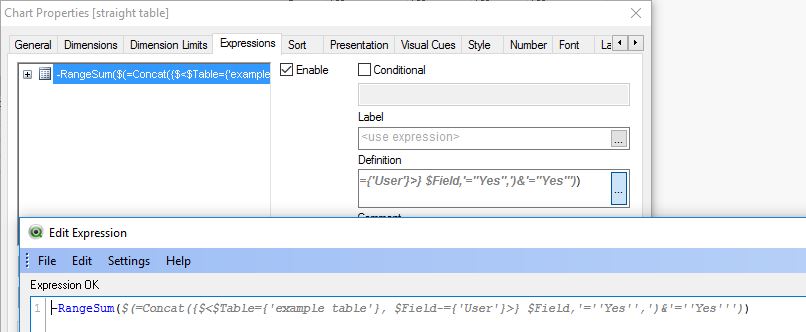
-RangeSum($(=Concat({$<$Table={'example table'}, $Field-={'User'}>} $Field,'=''Yes'',')&'=''Yes'''))
I would prefer Sunny's CrossTable solution though.
hope this helps
regards
Marco
- Mark as New
- Bookmark
- Subscribe
- Mute
- Subscribe to RSS Feed
- Permalink
- Report Inappropriate Content
Ok, another question.
I want to show a Bar Chart just with sum of "Yes" and "No" for all that collumns (Facebook, Linkedin...).
How can I do this? What field do I need to enter on Dimensions in the RangeSum use case?
Sorry for the question, I'm learning alone about this tool  .
.
Thanks.
- Mark as New
- Bookmark
- Subscribe
- Mute
- Subscribe to RSS Feed
- Permalink
- Report Inappropriate Content
=Count({<Facebook={YES'}>}Facebook)+Count({<Linkedin={YES'}>}Linkedin)+Count({<Twitter={YES'}>}Twitter)+Count({<Instagram={YES'}>}Instagram)
- Mark as New
- Bookmark
- Subscribe
- Mute
- Subscribe to RSS Feed
- Permalink
- Report Inappropriate Content
This count I insert o Measures. But which field I need to put on Dimensions?
- « Previous Replies
-
- 1
- 2
- Next Replies »