Unlock a world of possibilities! Login now and discover the exclusive benefits awaiting you.
- Qlik Community
- :
- All Forums
- :
- QlikView App Dev
- :
- How to count?
- Subscribe to RSS Feed
- Mark Topic as New
- Mark Topic as Read
- Float this Topic for Current User
- Bookmark
- Subscribe
- Mute
- Printer Friendly Page
- Mark as New
- Bookmark
- Subscribe
- Mute
- Subscribe to RSS Feed
- Permalink
- Report Inappropriate Content
How to count?
Hi Community,
The below screen shot is my input,

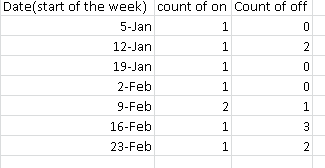
I need the output as below,

I have tried with some expressions, but I could not succeed.
Can some one help me with this.
Thanks in Advance.
- Mark as New
- Bookmark
- Subscribe
- Mute
- Subscribe to RSS Feed
- Permalink
- Report Inappropriate Content
Could you please explain the LOGIC how your getting that output ?? so that we can help you
- Mark as New
- Bookmark
- Subscribe
- Mute
- Subscribe to RSS Feed
- Permalink
- Report Inappropriate Content
Hi,
Can you please tell whats that count(on) and count (off) .
Table:
LOAD
Week(Date) as Week,
WeekStart(Date) as WeekStart,
WeekEnd(Date) as WeekEnd,
WeekDay(Date) as WeekDay,


 * INLINE [
    Date
    5/1/2015
   10/1/2015
    14/1/2015
    15/1/2015
    26/1/2015
    29/1/2015
    3/2/2015
    7/2/2015
    11/2/2015
];
Hope this helps for knowing week flow.
-Hirish
- Mark as New
- Bookmark
- Subscribe
- Mute
- Subscribe to RSS Feed
- Permalink
- Report Inappropriate Content
Hi,
Try like this
Data:
LOAD
Date AS ActualDate,
Date(MakeWeekDate(Year(Today(), OnWeekNumber), 'DD-MMM') AS Date,
1 AS OnCount
FROM DataSource;
Concatenate(Data)
Data:
LOAD
Date AS ActualDate,
Date(MakeWeekDate(Year(Today(), OffWeekNumber), 'DD-MMM') AS Date,
1 AS OffCount
FROM DataSource;
Now in chart try like below
Dimension: Date
Expression 1: Count of On
=Sum(OnCount)
Expression 1: Count of Off
=Sum(OffCount)
Hope this helps you.
Regards,
jagan.
- Mark as New
- Bookmark
- Subscribe
- Mute
- Subscribe to RSS Feed
- Permalink
- Report Inappropriate Content
I Think this is it.
Check the app
- Mark as New
- Bookmark
- Subscribe
- Mute
- Subscribe to RSS Feed
- Permalink
- Report Inappropriate Content
As 5th jan 2015 falls on week 2, 'count of on' should count only 2 in column 'on',
similarly 'count of off' should count 2 in the column 'off'. Here as there is no 2 in off column, the result will be zero(0).
Thanks
- Mark as New
- Bookmark
- Subscribe
- Mute
- Subscribe to RSS Feed
- Permalink
- Report Inappropriate Content
Yes that is the one. But if Iam trying the same by importing the data through excel, I could not get the exact output.