Unlock a world of possibilities! Login now and discover the exclusive benefits awaiting you.
- Qlik Community
- :
- All Forums
- :
- QlikView App Dev
- :
- Re: How to create Charts with different selections...
- Subscribe to RSS Feed
- Mark Topic as New
- Mark Topic as Read
- Float this Topic for Current User
- Bookmark
- Subscribe
- Mute
- Printer Friendly Page
- Mark as New
- Bookmark
- Subscribe
- Mute
- Subscribe to RSS Feed
- Permalink
- Report Inappropriate Content
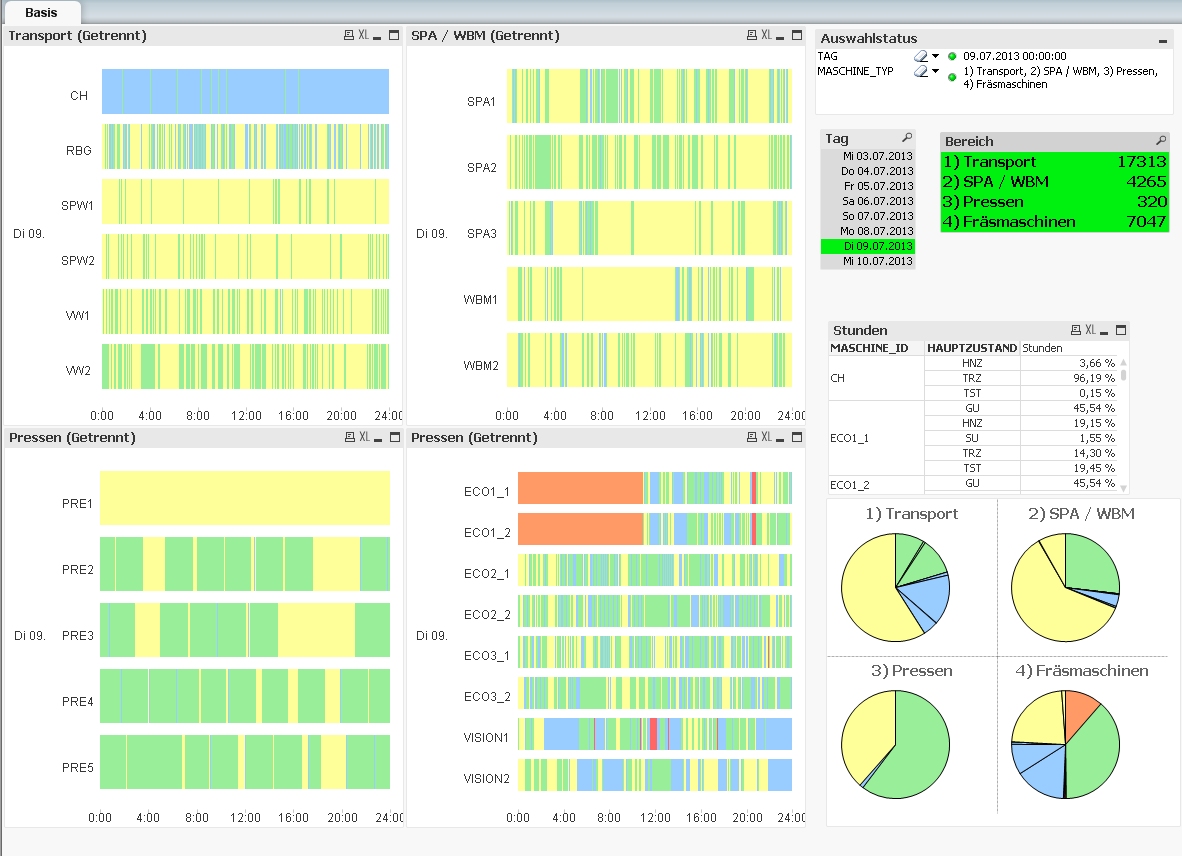
How to create Charts with different selections for the same dimension
I have a dimension with 4 distinct values ("Bereich") and I'd like to create one barchart for each value. However, I cannot lock the individual charts to their intended values. The only way I was able to achieve that was by "disconnecting" and changing the selection one after another:
- Tags:
- new_to_qlikview
Accepted Solutions
- Mark as New
- Bookmark
- Subscribe
- Mute
- Subscribe to RSS Feed
- Permalink
- Report Inappropriate Content
Did you try something like this?
For each chart, use Set Analysis to select the subset values of the Dimension:
Chart 1:
Expression: sum ({<Bereich={'1) Transport'}>} field)
Chart 2:
Expression: sum ({<Bereich={'2) SPA / WBM'}>} field)
and so on...
- Mark as New
- Bookmark
- Subscribe
- Mute
- Subscribe to RSS Feed
- Permalink
- Report Inappropriate Content
Hi,
You can use four charts with 4 different expressions like below
sum ({<DimensionName={'Value1'}>} MeasureName)
sum ({<DimensionName={'Value2'}>} MeasureName)
sum ({<DimensionName={'Value3'}>} MeasureName)
sum ({<DimensionName={'Value4'}>} MeasureName)
Hope this helps you.
Regards,
Jagan.
- Mark as New
- Bookmark
- Subscribe
- Mute
- Subscribe to RSS Feed
- Permalink
- Report Inappropriate Content
Create 4 different bar charts with same data but edit the dimension tab of each of them to
1. If(Dimension='Value1', Dimension)
2. If(Dimension='Value2', Dimension)
3. If(Dimension='Value3', Dimension)
4. If(Dimension='Value4', Dimension)
- Mark as New
- Bookmark
- Subscribe
- Mute
- Subscribe to RSS Feed
- Permalink
- Report Inappropriate Content
You could also try using a Trellis Chart as then you will retain the same axis scale between the different possibilites.
This helps retain teh relative comparison between your 4 items.