Unlock a world of possibilities! Login now and discover the exclusive benefits awaiting you.
- Qlik Community
- :
- All Forums
- :
- QlikView App Dev
- :
- How to create Top 10 and Sum remaining non-Top 10 ...
- Subscribe to RSS Feed
- Mark Topic as New
- Mark Topic as Read
- Float this Topic for Current User
- Bookmark
- Subscribe
- Mute
- Printer Friendly Page
- Mark as New
- Bookmark
- Subscribe
- Mute
- Subscribe to RSS Feed
- Permalink
- Report Inappropriate Content
How to create Top 10 and Sum remaining non-Top 10 as one single line item?
Query: how to get the desired results from data below?
Data
RANK | CTPY | AMT |
1 | A | 15 |
2 | B | 14 |
3 | C | 13 |
4 | D | 12 |
5 | E | 11 |
6 | F | 10 |
7 | G | 9 |
8 | H | 8 |
9 | I | 7 |
10 | J | 6 |
11 | K | 5 |
12 | L | 4 |
13 | M | 3 |
14 | N | 2 |
15 | O | 1 |
Desired results
RANK | CTPY | AMT |
1 | A | 15 |
2 | B | 14 |
3 | C | 13 |
4 | D | 12 |
5 | E | 11 |
6 | F | 10 |
7 | G | 9 |
8 | H | 8 |
9 | I | 7 |
10 | J | 6 |
REMAINDER |
| 15 |
Thanks!
- « Previous Replies
-
- 1
- 2
- Next Replies »
- Mark as New
- Bookmark
- Subscribe
- Mute
- Subscribe to RSS Feed
- Permalink
- Report Inappropriate Content
Hi Shi,
this looks to be a straight table? If so you can use the dimension limits tab to display just the top 10 like this.
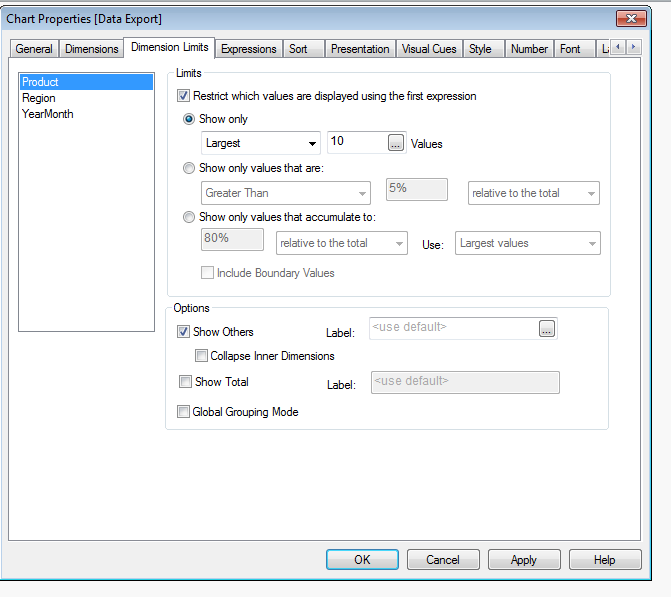
hope that helps
Joe
- Mark as New
- Bookmark
- Subscribe
- Mute
- Subscribe to RSS Feed
- Permalink
- Report Inappropriate Content
hi,
It can be done by setting dimention limit as 10,in dimention limit tab as said by Joe above.
you wrote--sum remaining non top 10 as one single line item---what do you mean by this.
do you want sum of remaining to come in one line.
If yes den do reply.
Thanks
sudhanshu shrivas
- Mark as New
- Bookmark
- Subscribe
- Mute
- Subscribe to RSS Feed
- Permalink
- Report Inappropriate Content
- Need the remaining to sum to one line
- Also need to show the total amounts i.e. Top 10 + Remainder = Total
Thanks!
- Mark as New
- Bookmark
- Subscribe
- Mute
- Subscribe to RSS Feed
- Permalink
- Report Inappropriate Content
Ensure you tick the 'show others' and 'show total' boxes on dimension limits and this should give you the desired result
hope that helps
Joe
- Mark as New
- Bookmark
- Subscribe
- Mute
- Subscribe to RSS Feed
- Permalink
- Report Inappropriate Content
Rightly said.
in dimension limits.You have show others.just check it and you wil get your desired resultt.
Thanks
S Shrivas
- Mark as New
- Bookmark
- Subscribe
- Mute
- Subscribe to RSS Feed
- Permalink
- Report Inappropriate Content
...and if its important, don't forget to use 'Remainder' as the label for the 'Show Others' total.
- Mark as New
- Bookmark
- Subscribe
- Mute
- Subscribe to RSS Feed
- Permalink
- Report Inappropriate Content
Good point, I forgot to add that
- Mark as New
- Bookmark
- Subscribe
- Mute
- Subscribe to RSS Feed
- Permalink
- Report Inappropriate Content
Dimension: =If(Aggr(Rank(Sum(AMT)),CTPY)<11, CTPY,'Others')
Expr: Sum(AMT)
- Mark as New
- Bookmark
- Subscribe
- Mute
- Subscribe to RSS Feed
- Permalink
- Report Inappropriate Content
Hi,
All are right use Dimension limits for this go to
1. Chart properties >> Dimension Limits >> Select Largest >> and enter value 11
Check settings
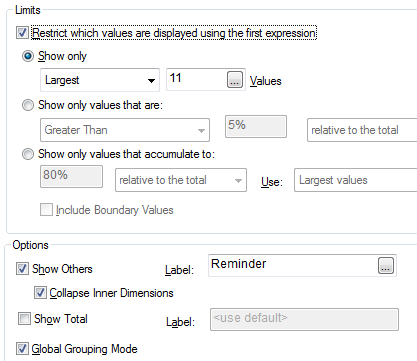
And you get output like this way
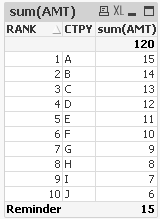
Regards
Anand
- « Previous Replies
-
- 1
- 2
- Next Replies »