Unlock a world of possibilities! Login now and discover the exclusive benefits awaiting you.
Announcements
Only at Qlik Connect! Guest keynote Jesse Cole shares his secrets for daring to be different. Learn More!
- Qlik Community
- :
- All Forums
- :
- QlikView App Dev
- :
- Re: How to create a bar chart to show the completi...
Options
- Subscribe to RSS Feed
- Mark Topic as New
- Mark Topic as Read
- Float this Topic for Current User
- Bookmark
- Subscribe
- Mute
- Printer Friendly Page
Turn on suggestions
Auto-suggest helps you quickly narrow down your search results by suggesting possible matches as you type.
Showing results for
Anonymous
Not applicable
2018-08-15
01:32 AM
- Mark as New
- Bookmark
- Subscribe
- Mute
- Subscribe to RSS Feed
- Permalink
- Report Inappropriate Content
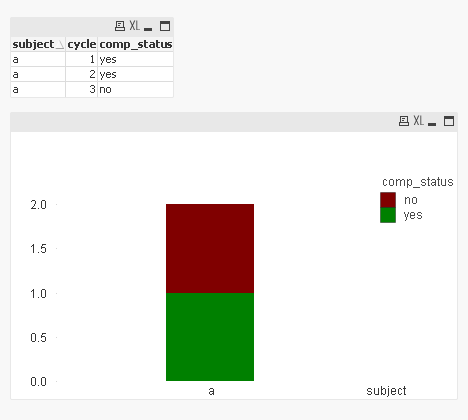
How to create a bar chart to show the completion status in Green color if it is Yes and Red if it is No? Please help me
Greetings all,
For the above table i want a stacked bar chart with color green if comp_status is yes and red it is no. Can someone help me with that please?
1,093 Views
1 Solution
Accepted Solutions
Master II
2018-08-15
08:06 AM
- Mark as New
- Bookmark
- Subscribe
- Mute
- Subscribe to RSS Feed
- Permalink
- Report Inappropriate Content
6 Replies
2018-08-15
05:56 AM
- Mark as New
- Bookmark
- Subscribe
- Mute
- Subscribe to RSS Feed
- Permalink
- Report Inappropriate Content
You can use BG color like from expression expand.
If(comp_status='yes', Green(), If(comp_status='no', Red()))
Best Anil, When applicable please mark the correct/appropriate replies as "solution" (you can mark up to 3 "solutions". Please LIKE threads if the provided solution is helpful
1,012 Views
Anonymous
Not applicable
2018-08-15
06:50 AM
Author
- Mark as New
- Bookmark
- Subscribe
- Mute
- Subscribe to RSS Feed
- Permalink
- Report Inappropriate Content
Hello Anil,
Thank you for the reply. I would like to know what expression should i mention in the expression tab of the chart. I took comp_status as Dimension
1,012 Views
Master II
2018-08-15
08:06 AM
- Mark as New
- Bookmark
- Subscribe
- Mute
- Subscribe to RSS Feed
- Permalink
- Report Inappropriate Content
Hope the attachment will help:

2018-08-15
09:27 AM
- Mark as New
- Bookmark
- Subscribe
- Mute
- Subscribe to RSS Feed
- Permalink
- Report Inappropriate Content
That's based on your business. In your table you have 3 columns. Which is your dimension and measure that you have to decide. But, Try Count(subject) or Sum(cycle)
Best Anil, When applicable please mark the correct/appropriate replies as "solution" (you can mark up to 3 "solutions". Please LIKE threads if the provided solution is helpful
1,012 Views
Anonymous
Not applicable
2018-08-15
12:38 PM
Author
- Mark as New
- Bookmark
- Subscribe
- Mute
- Subscribe to RSS Feed
- Permalink
- Report Inappropriate Content
Thank you very much
Master II
2018-08-15
12:40 PM
- Mark as New
- Bookmark
- Subscribe
- Mute
- Subscribe to RSS Feed
- Permalink
- Report Inappropriate Content
You are welcome.
1,012 Views