Unlock a world of possibilities! Login now and discover the exclusive benefits awaiting you.
- Qlik Community
- :
- All Forums
- :
- QlikView App Dev
- :
- Re: How to create a crosstab at this scenario?
- Subscribe to RSS Feed
- Mark Topic as New
- Mark Topic as Read
- Float this Topic for Current User
- Bookmark
- Subscribe
- Mute
- Printer Friendly Page
- Mark as New
- Bookmark
- Subscribe
- Mute
- Subscribe to RSS Feed
- Permalink
- Report Inappropriate Content
How to create a crosstab at this scenario?
hi ,
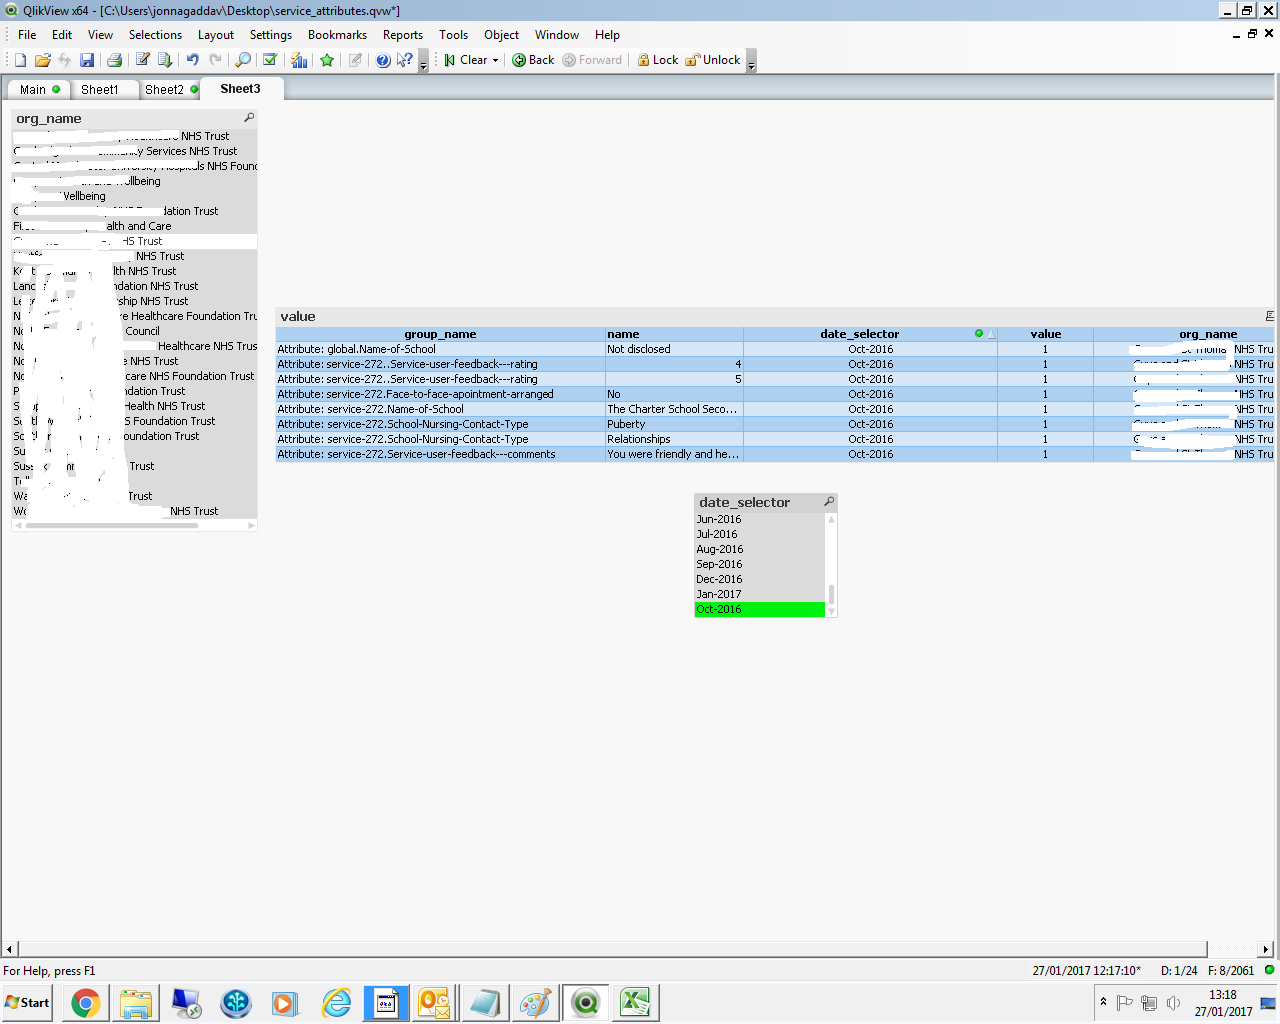
I need to create a crosstable I guess it is pivot table based on my requirement like
I have dimensions called 'Group_name', 'name', 'Date_selector', 'organisation'.
Once we select the group name we will get respective names like Contact Type, Name of school.etc;
so I need to display a table that shows like this based on the select of various organisations.
I am attaching the pic of 2 files.
Any help is highly appreciated.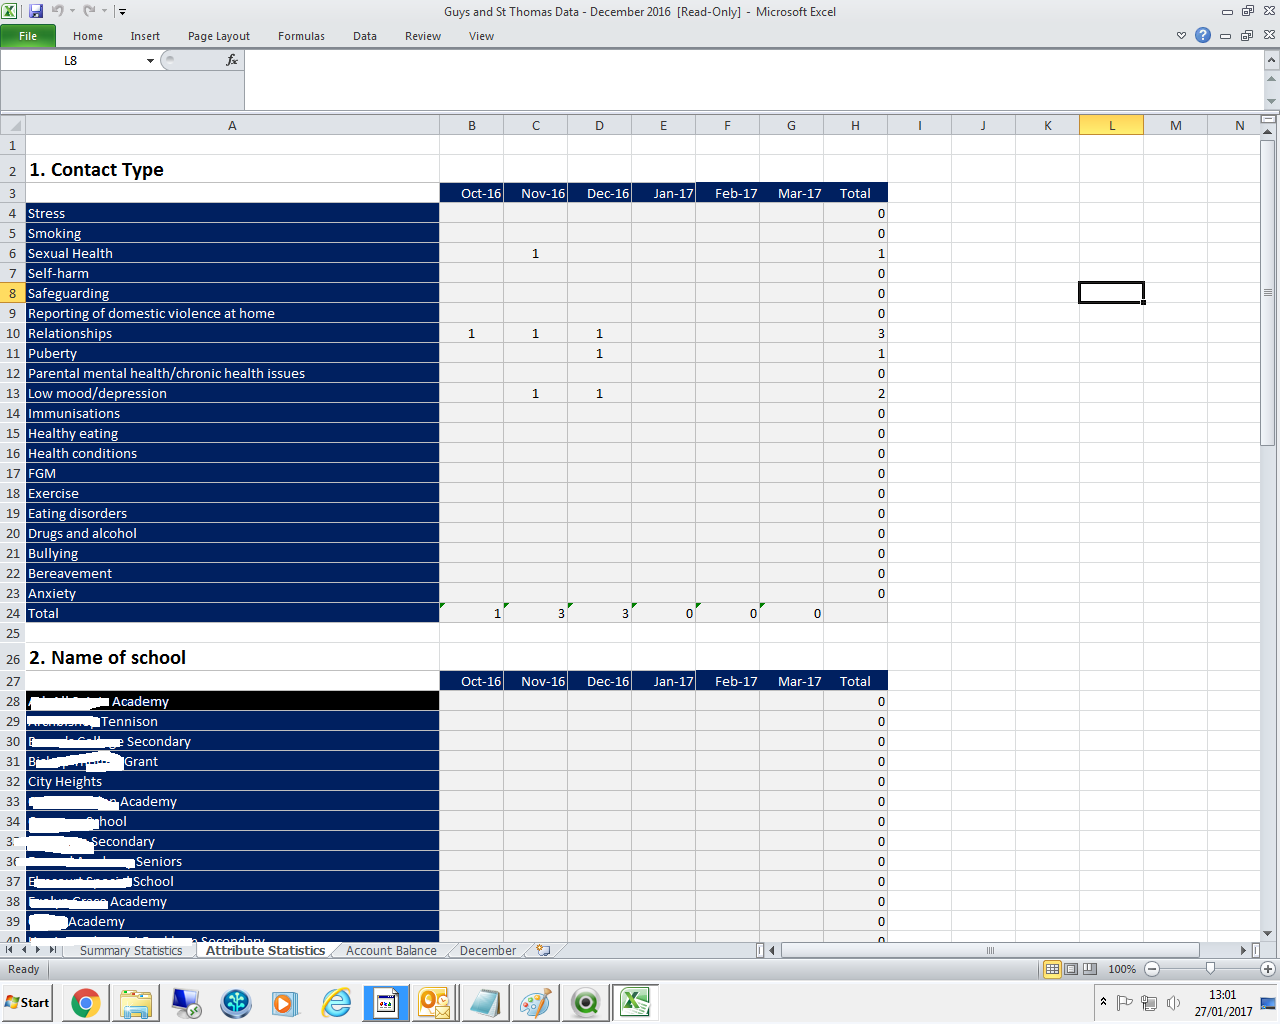
Accepted Solutions
- Mark as New
- Bookmark
- Subscribe
- Mute
- Subscribe to RSS Feed
- Permalink
- Report Inappropriate Content
Not sure what the problem is here!!
Create a pivot table and drag date_selector field above the expression, you will see a blue line indicating the position
A sample would help
If a post helps to resolve your issue, please accept it as a Solution.
- Mark as New
- Bookmark
- Subscribe
- Mute
- Subscribe to RSS Feed
- Permalink
- Report Inappropriate Content
Hi Pujari,
Thank you it worked how you explained.
But how to avoid Totals in Name as it is calculating for every group name which is not required.
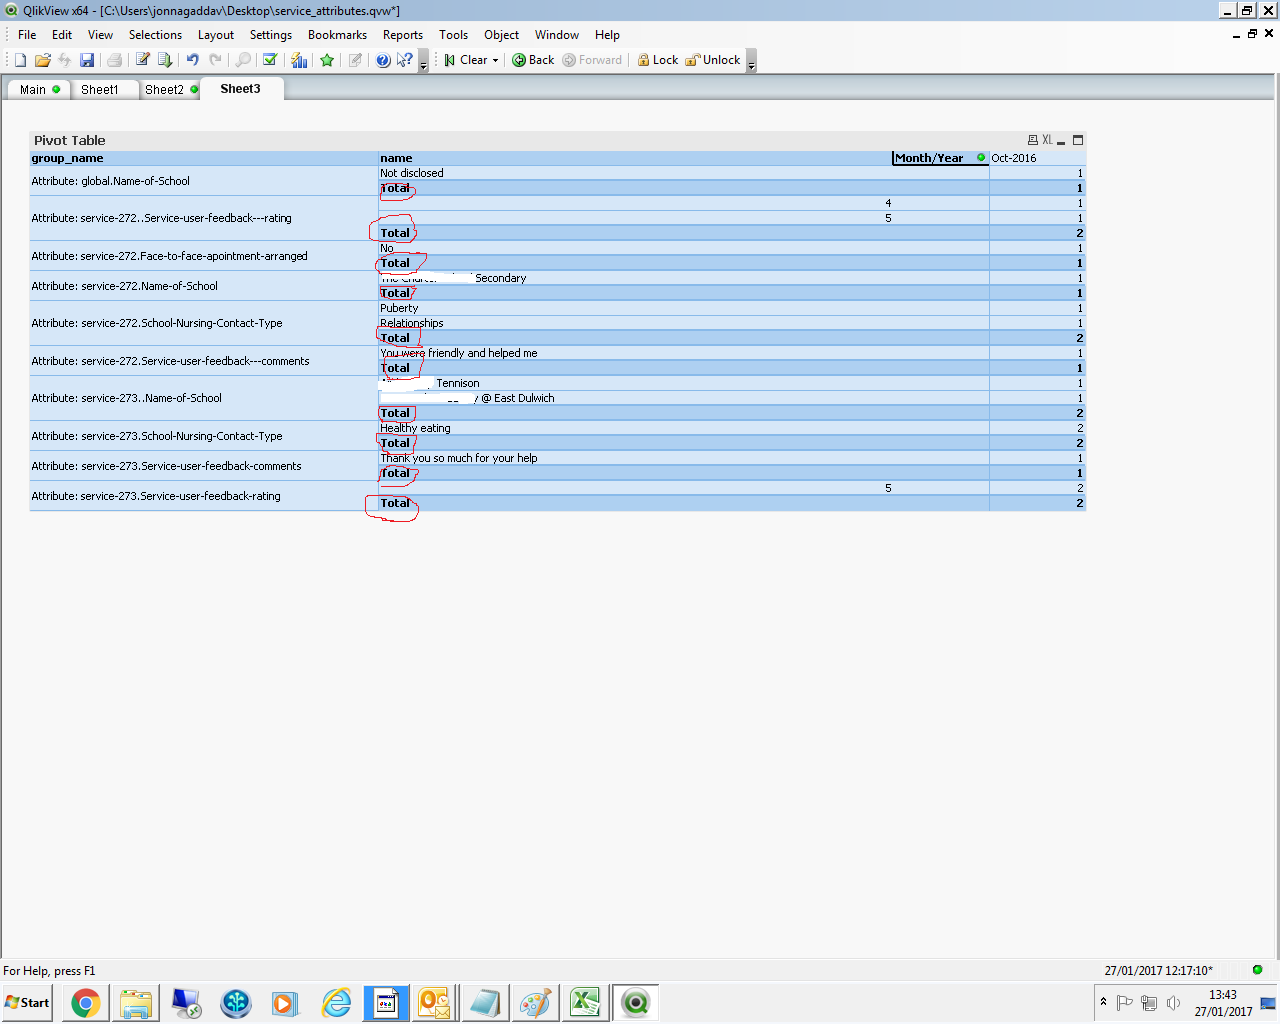
~But wanted the total like in the previos First Pic where you can see Total at the bottom.
- Mark as New
- Bookmark
- Subscribe
- Mute
- Subscribe to RSS Feed
- Permalink
- Report Inappropriate Content
go to presentation tab and disable partial sums for "name" or "group_name" dimension and enable for MonthYear dimension
If a post helps to resolve your issue, please accept it as a Solution.
- Mark as New
- Bookmark
- Subscribe
- Mute
- Subscribe to RSS Feed
- Permalink
- Report Inappropriate Content
Thanks vineeth.
Perfect. Job done.