Unlock a world of possibilities! Login now and discover the exclusive benefits awaiting you.
- Qlik Community
- :
- All Forums
- :
- QlikView App Dev
- :
- How to create a custom shaped 'Text object' rather...
- Subscribe to RSS Feed
- Mark Topic as New
- Mark Topic as Read
- Float this Topic for Current User
- Bookmark
- Subscribe
- Mute
- Printer Friendly Page
- Mark as New
- Bookmark
- Subscribe
- Mute
- Subscribe to RSS Feed
- Permalink
- Report Inappropriate Content
How to create a custom shaped 'Text object' rather than the Box shaped?
Hi,
I want to create a custom shaped text object like the ones I attached.So that with the value of the Variable ,i can color the text object as Red,Yellow or Green.I could create a text object (box shaped) and then select image but if i do this i could not colour it according to some condition.
Any help greatly appreciated.Thank you.
Accepted Solutions
- Mark as New
- Bookmark
- Subscribe
- Mute
- Subscribe to RSS Feed
- Permalink
- Report Inappropriate Content
Hi kevincool,
Try this test data in a new qv doc (the bitmap images need to be stored in same folder as the qv doc) ...
SpecialIcons:
LOAD * INLINE [
Colour, PicName
R, ico_bodyred
Y, ico_bodyyellow
G, ico_bodygreen
];
SpecialIcons:
INFO LOAD * INLINE [
PicName, Path
ico_bodyred, bodyRed.bmp
ico_bodyyellow, bodyYellow.bmp
ico_bodygreen, bodyGreen.bmp
];
Data:
LOAD * INLINE [
Location, v1, v2, v3, v4, v5, v6
London, R, R, R, Y, Y, G
Paris, R, Y, Y, G, G, G
NewYork, R, R, Y, Y, G, G
];
When loaded, create a straight table chart with Location as dimension and 6x expressions ...
=if(v1='R','qmem://PicName/ico_bodyred', if(v1='Y','qmem://PicName/ico_bodyyellow','qmem://PicName/ico_bodygreen'))
=if(v2='R','qmem://PicName/ico_bodyred', if(v2='Y','qmem://PicName/ico_bodyyellow','qmem://PicName/ico_bodygreen'))
... and so on.
Is this what you need?
flipside
PS The expressions need representation as an image, and you might need to tweak the Image Formatting to suit.
- Mark as New
- Bookmark
- Subscribe
- Mute
- Subscribe to RSS Feed
- Permalink
- Report Inappropriate Content
is this not what you need?
- Mark as New
- Bookmark
- Subscribe
- Mute
- Subscribe to RSS Feed
- Permalink
- Report Inappropriate Content
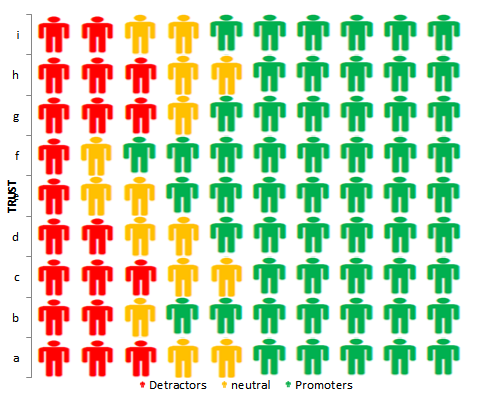
Thanks for the reply but its not that simple.Pleasesee the image above.There is a field trust with 15 fieldnames and num(score) is the expression.Each trust has some value for detractors,neutral,promoters which is less than 10.ex:- trust a has D=3,N=2 and P=5
So if i have 10 human objects all in white color,I want to color them according to the values of Det..,neutral and promoters.
I could create text objects with images and give show condition to them but if i want to do that ,i have to create morre than 250 text objects.Any simple solution please...
- Mark as New
- Bookmark
- Subscribe
- Mute
- Subscribe to RSS Feed
- Permalink
- Report Inappropriate Content
This is the only thing that comes to my mind....
- Mark as New
- Bookmark
- Subscribe
- Mute
- Subscribe to RSS Feed
- Permalink
- Report Inappropriate Content
I remember there was a QV extension somewhere around there that displayed that kind of graph. I searched for it, but couldn't find it. probably somebody knows where to find it.
- Mark as New
- Bookmark
- Subscribe
- Mute
- Subscribe to RSS Feed
- Permalink
- Report Inappropriate Content
Thanks thats simple,but the customer wants the human objects rather than the rectangle square ones which qlikview provides.think i have to start creating 300 text objects with images................
- Mark as New
- Bookmark
- Subscribe
- Mute
- Subscribe to RSS Feed
- Permalink
- Report Inappropriate Content
Can anyone create a custom object as the human image,someone with OO Programming knowledge,so that i can use it on qlikview as a extension
- Mark as New
- Bookmark
- Subscribe
- Mute
- Subscribe to RSS Feed
- Permalink
- Report Inappropriate Content
Hi kevincool,
Try this test data in a new qv doc (the bitmap images need to be stored in same folder as the qv doc) ...
SpecialIcons:
LOAD * INLINE [
Colour, PicName
R, ico_bodyred
Y, ico_bodyyellow
G, ico_bodygreen
];
SpecialIcons:
INFO LOAD * INLINE [
PicName, Path
ico_bodyred, bodyRed.bmp
ico_bodyyellow, bodyYellow.bmp
ico_bodygreen, bodyGreen.bmp
];
Data:
LOAD * INLINE [
Location, v1, v2, v3, v4, v5, v6
London, R, R, R, Y, Y, G
Paris, R, Y, Y, G, G, G
NewYork, R, R, Y, Y, G, G
];
When loaded, create a straight table chart with Location as dimension and 6x expressions ...
=if(v1='R','qmem://PicName/ico_bodyred', if(v1='Y','qmem://PicName/ico_bodyyellow','qmem://PicName/ico_bodygreen'))
=if(v2='R','qmem://PicName/ico_bodyred', if(v2='Y','qmem://PicName/ico_bodyyellow','qmem://PicName/ico_bodygreen'))
... and so on.
Is this what you need?
flipside
PS The expressions need representation as an image, and you might need to tweak the Image Formatting to suit.
- Mark as New
- Bookmark
- Subscribe
- Mute
- Subscribe to RSS Feed
- Permalink
- Report Inappropriate Content
Thanks ,will try it now.
- Mark as New
- Bookmark
- Subscribe
- Mute
- Subscribe to RSS Feed
- Permalink
- Report Inappropriate Content
@flipside .Thanks a lot.I got it,Will create my chart from your technique.