Unlock a world of possibilities! Login now and discover the exclusive benefits awaiting you.
- Qlik Community
- :
- All Forums
- :
- QlikView App Dev
- :
- Re: How to create a frequency matrix of order comp...
Options
- Subscribe to RSS Feed
- Mark Topic as New
- Mark Topic as Read
- Float this Topic for Current User
- Bookmark
- Subscribe
- Mute
- Printer Friendly Page
Turn on suggestions
Auto-suggest helps you quickly narrow down your search results by suggesting possible matches as you type.
Showing results for
Not applicable
2015-02-27
06:24 AM
- Mark as New
- Bookmark
- Subscribe
- Mute
- Subscribe to RSS Feed
- Permalink
- Report Inappropriate Content
How to create a frequency matrix of order complexity
Hi there,
I need some help with the following...
I want to create a frequency matrix that shows me the frequency of materials and shipping points used in an order.
By this report I want to meassure the complexity of orders.
The more shipping points and the more materials used in one order, the more complex the order is.
I have added a table (excel) with the orders data.
From this table I want to generate a matrix as showed below
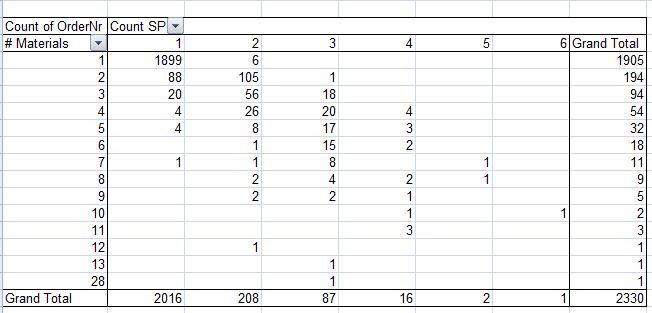
Can anyone help me to build this matrix in QlikView?
Regards,
Cor
- Tags:
- qlikview
856 Views
1 Solution
Accepted Solutions
Partner - Champion III
2015-02-27
10:15 AM
- Mark as New
- Bookmark
- Subscribe
- Mute
- Subscribe to RSS Feed
- Permalink
- Report Inappropriate Content
713 Views
2 Replies
Partner - Champion III
2015-02-27
10:15 AM
- Mark as New
- Bookmark
- Subscribe
- Mute
- Subscribe to RSS Feed
- Permalink
- Report Inappropriate Content
See attached qvw.
talk is cheap, supply exceeds demand
714 Views
Not applicable
2015-02-27
10:46 AM
Author
- Mark as New
- Bookmark
- Subscribe
- Mute
- Subscribe to RSS Feed
- Permalink
- Report Inappropriate Content
Hi Gysbert,
This did worked out perfectly.
Thanks for you help 
Regards,
Cor
713 Views